The biggest single-month exit ever from both funds came just 24 hours before Asia’s sharpest equity rebound in a year, a rebound that reversed within days
Key Takeaways
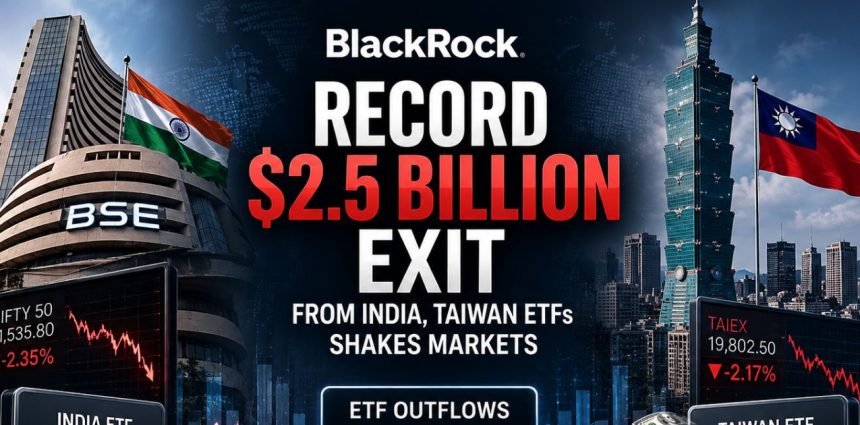
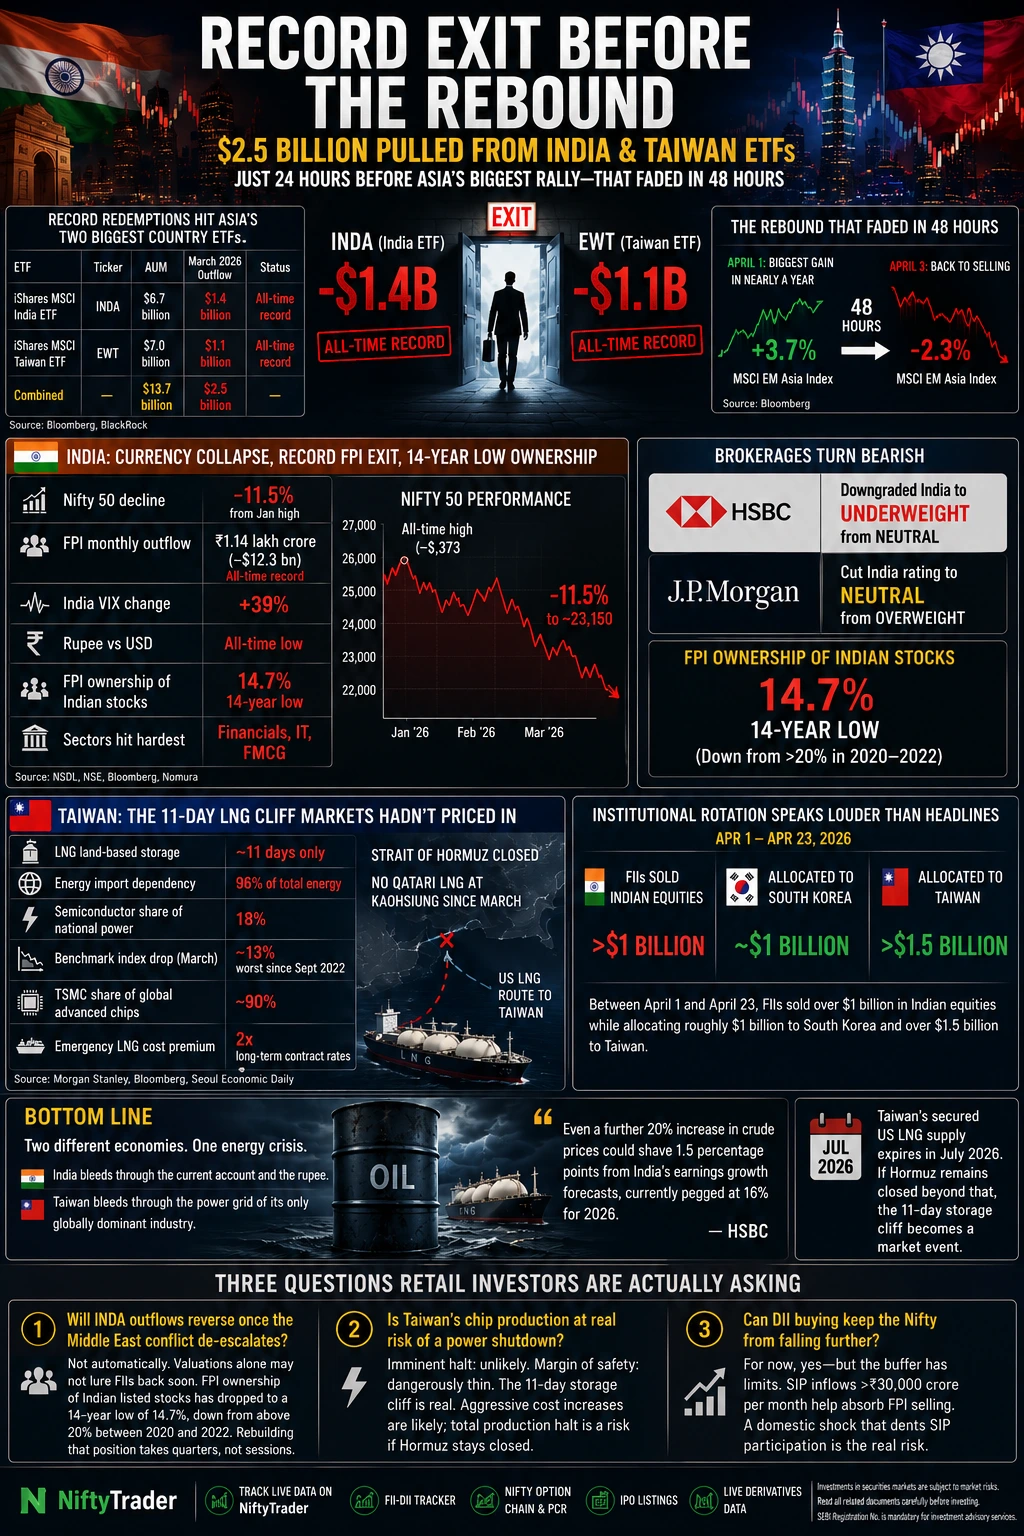
- BlackRock’s iShares MSCI India ETF (INDA) saw a record $1.4 billion exit in March 2026, per Bloomberg data
- iShares MSCI Taiwan ETF (EWT) recorded a record $1.1 billion redemption the same month
- FPIs pulled a record ₹1.14 lakh crore (~$12.3 billion) from Indian equities in March alone
- Nifty 50 fell 11.5% in March; India VIX surged 39%; rupee hit all-time low vs USD
- Taiwan’s benchmark dropped ~13% as Morgan Stanley flagged an 11-day LNG storage cliff
- April 1 rebound gave way to fresh selling, Asian EM stocks dropped 2.3% within 48 hours
- HSBC downgraded India to Underweight; JPMorgan cut to Neutral; FPI ownership at 14-year low of 14.7%
Record Redemptions Hit Asia’s Two Biggest Country ETFs
In March 2026, traders pulled a record $1.4 billion from BlackRock’s $6.7 billion iShares MSCI India ETF (INDA), according to data compiled by Bloomberg.
The firm’s $7 billion iShares MSCI Taiwan ETF (EWT) also saw a record redemption of $1.1 billion last month, making March the worst month on record for both funds simultaneously.
The combined $2.5 billion exit from just two single-country ETFs in one calendar month has no precedent in the history of either product.
The exit came one day before Asian equities posted their sharpest single-session gain in nearly a year. That bounce lasted less than 48 hours.
| ETF | Ticker | AUM | March 2026 Outflow | Status |
|---|---|---|---|---|
| iShares MSCI India ETF | INDA | $6.7 billion | $1.4 billion | All-time record |
| iShares MSCI Taiwan ETF | EWT | $7.0 billion | $1.1 billion | All-time record |
| Combined | — | $13.7 billion | $2.5 billion | — |
Source: Bloomberg, BlackRock
👉 Track live FII/DII activity on NiftyTrader’s FII-DII Tracker
India: Currency Collapse, Record FPI Exit, 14-Year Low Ownership
India’s equity market did not just underperform in March, it broke records in the wrong direction across every metric that matters to foreign investors.
FIIs withdrew a record ₹1.14 lakh crore from Indian equities in March 2026, marking the highest monthly outflow ever recorded, primarily triggered by escalating geopolitical tensions in West Asia, a sharp surge in crude oil prices, and a weakening Indian rupee.
The Nifty 50 fell to around 23,150 points, an 11.5% correction from its all-time high of 26,373 reached in January, while the India VIX jumped 39% during the month.
The Indian rupee hit a record low against the US dollar, adding pressure on foreign investors’ returns as rising treasury yields simultaneously boosted the attraction of dollar-driven assets.
The sector-level damage was concentrated. Financial services, IT, and FMCG bore the brunt of FPI outflows, with FMCG companies facing heavy selling due to slowing urban consumption and margin pressures from rising input costs.
India is considered “one of the most vulnerable countries to higher oil prices” as its net oil imports amount to 3.5% of GDP, and analysts warn that sustained higher oil prices could keep the rupee under continued pressure.
For a dollar-denominated fund like INDA, a flat index combined with rupee depreciation already produces a negative dollar return. That arithmetic is what accelerated the institutional exit.
Foreign brokerages HSBC and JPMorgan downgraded Indian equities, with JPMorgan lowering India’s rating to ‘Neutral’ from ‘Overweight’ and HSBC funding its Korea upgrade by downgrading India to ‘Underweight’ from ‘Neutral’, citing weakening growth and forex pressure.
| India Market Indicator | March 2026 Reading |
|---|---|
| Nifty 50 decline | ~11.5% from Jan high |
| FPI monthly outflow | ₹1.14 lakh crore (~$12.3 bn) — all-time record |
| India VIX change | +39% |
| Rupee vs USD | All-time low |
| FPI ownership of Indian stocks | 14.7% — 14-year low |
| Sectors hit hardest | Financials, IT, FMCG |
Source: NSDL, NSE, Bloomberg, Nomura
Check Here: India VIX Live – Today’s Level, Chart & History
Taiwan: The 11-Day LNG Cliff Markets Hadn’t Priced In
Taiwan’s 13% benchmark decline in March looked like a valuation call. It was actually an energy security crisis hiding inside a tech-stock selloff.
According to a Morgan Stanley Tech Bytes report, the closure of the Strait of Hormuz has created a looming “LNG cliff” for Taiwanese foundries and a secondary “sulfur squeeze” threatening the production of critical battery and chip materials, with Taiwan typically maintaining only about 11 days of LNG storage on land.
Taiwan imports approximately 96% of its energy, with LNG accounting for half of that, while the semiconductor industry consumes 18% of the electricity generated from these energy sources. Not a single LNG carrier from Qatar has arrived at the Yongan Terminal in Kaohsiung since the Strait of Hormuz was blocked in March.
TSMC alone manufactures 90% of all advanced chips globally and consumes approximately 9–10% of Taiwan’s total power, meaning any power volatility could have immediate knock-on effects for the global supply of AI and smartphone processors.
What kept EWT from falling further than 13%: semiconductor companies retain strong pricing power given heavily skewed supply-demand dynamics, with analysts noting they are largely able to pass on additional costs to end customers. That pricing buffer is real — but it does not solve an energy cliff.
The Taiwanese government has responded by importing LNG from the United States instead of the Middle East, securing spot market volumes through July at prices twice as high as long-term contract rates. Cost inflation is already baked in; production disruption is not yet imminent, but the margin is thin.
| Taiwan Risk Metric | Detail |
|---|---|
| LNG land-based storage | ~11 days only |
| Energy import dependency | 96% of total energy |
| Semiconductor share of national power | 18% |
| Benchmark index drop (March) | ~13% — worst since Sept 2022 |
| TSMC share of global advanced chips | ~90% |
| Emergency LNG cost premium | 2x long-term contract rates |
Source: Morgan Stanley, Bloomberg, Seoul Economic Daily
👉 Monitor Nifty Option Chain and PCR live at NiftyTrader
The April 1 Rebound Was Real. It Reversed in 48 Hours.
Asian equities jumped sharply on April 1, the biggest single-day gain in close to a year, after President Trump suggested he wanted a faster exit from the Middle East conflict. Traders who had been selling all month reversed positions in a single session.
It did not hold. Within 48 hours, Trump said the United States would continue attacks on Iran without committing to a specific timeline, sending oil prices surging more than $5 a barrel, with Brent crude jumping to $107.49 per barrel.
The MSCI gauge of EM Asia equities dropped 2.3%, South Korea’s KOSPI fell 4.2%, and markets in Taiwan and Indonesia also declined, losing about 1.4% and 1% respectively.
The April 1 move was a positioning squeeze, not a trend reversal. Institutions that exited INDA and EWT in March had already made their structural call, one single Trump statement was not going to reverse three months of macro deterioration.
What stood out was the institutional rotation underneath the headline bounce. Between April 1 and April 23, FIIs sold over $1 billion in Indian equities while simultaneously allocating roughly $1 billion to South Korea and over $1.5 billion to Taiwan, confirming the April 1 gain in India was retail-driven noise, not institutional re-entry.
Bottom Line
BlackRock’s record March redemptions in INDA and EWT are a symptom, not the story. The story is that two of Asia’s most investor-tracked economies, India and Taiwan, are facing structurally different versions of the same energy crisis, and neither has a quick exit. India bleeds through the current account and the rupee. Taiwan bleeds through the power grid of its only globally dominant industry.
HSBC has warned that even a further 20% increase in crude prices could shave 1.5 percentage points from India’s earnings growth forecasts, currently pegged at 16% for 2026.
For Taiwan, the trigger to watch is not a sentiment headline; it is whether a second LNG shipment from the US docks at Kaohsiung before July’s secured supply runs out.
The next hard data point for both: Taiwan’s secured US LNG supply expires in July 2026. If Hormuz remains closed beyond that, the 11-day storage cliff becomes a market event, not just a Morgan Stanley risk footnote.
👉 Track IPO listings, FII flows, and live derivatives data at NiftyTrader
Three Questions Retail Investors Are Actually Asking
Q1. Will INDA outflows reverse once the Middle East conflict de-escalates?
Not automatically. Analysts warn that attractive valuations alone may not lure foreign investors back soon, with one Oxford Economics strategist noting the decline in valuations is “not compelling enough to draw foreign investors in the near term” given geopolitical uncertainty and elevated global risk premia. FPI ownership of Indian listed stocks has already dropped to a 14-year low of 14.7%, down from above 20% between 2020 and 2022. Rebuilding that position takes quarters, not sessions.
Q2. Is Taiwan’s chip production at real risk of a power shutdown?
Imminent halt: unlikely. Margin of safety: dangerously thin. The Taiwanese government has secured US LNG spot volumes through July, though at twice normal contract rates. Morgan Stanley analysts maintain the immediate reality is likely aggressive cost increases rather than a total production halt, though they describe it as “a risk worth monitoring for global technology and AI chip supply.” Every week the Hormuz closure extends; that margin narrows.
Q3. Can DII buying keep the Nifty from falling further?
For now, yes — but the buffer has limits. SIP inflows have consistently crossed ₹30,000 crore per month, with SIP AUM reaching a record ₹16.64 lakh crore in February 2026, allowing DIIs to absorb intense FPI selling and prevent a steeper market crash. The risk is a domestic economic shock that dents retail SIP participation precisely when FPI selling has not yet reversed.
Disclaimer: This article is for informational and educational purposes only and does not constitute investment advice or a recommendation to buy or sell any security. Investments in securities markets are subject to market risks. Please read all related documents carefully before investing. SEBI Registration No. is mandatory for providing investment advisory services.