
KEI Industries shares fell sharply after its September-quarter results showed strong sales growth but weaker operating margins. NiftyTrader’s futures data revealed contrasting open-interest changes across October and November expiries.
October 22, 2026 | Thursday
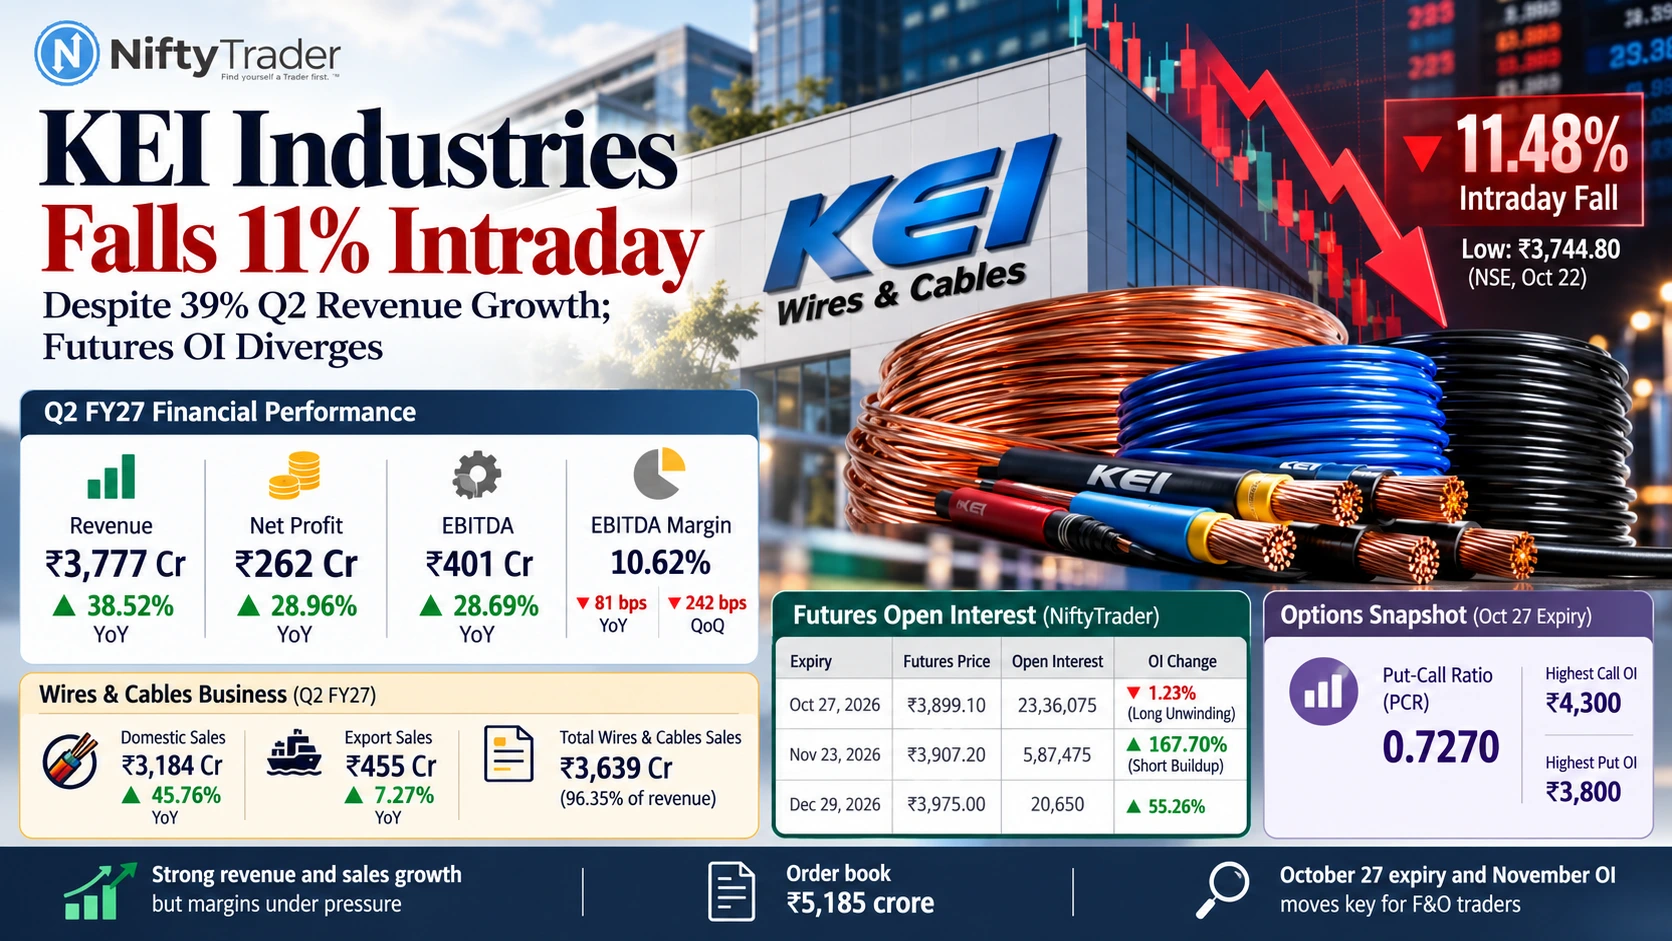
KEI Industries’ share price fell as much as 11.48% intraday to ₹3,744.80 on the NSE on Thursday, October 22, after the wires and cables manufacturer reported its Q2 FY27 earnings.
The sharp decline followed a 38.52% year-on-year increase in revenue to approximately ₹3,777 crore and a 28.96% rise in net profit to around ₹262 crore.
However, the company’s EBITDA margin narrowed to 10.62% from 11.43% a year earlier and 13.04% in the preceding quarter, putting profitability under scrutiny despite robust revenue growth.
Meanwhile, NiftyTrader’s KEI futures data showed a divergence between October and November open interest (OI), adding another dimension to the stock’s post-earnings reaction.
KEI Industries Q2 Results: Revenue Jumps 39%, But Margins Shrink
According to KEI Industries’ official earnings presentation filed with the NSE on October 21, revenue from operations increased 38.52% year-on-year in the July–September quarter.
Net profit rose 28.96%, while EBITDA increased 28.69% to approximately ₹401 crore.
Despite higher earnings compared with the year-ago quarter, sequential performance showed pressure on profitability.
| Financial metric | Q2 FY27 | Change |
|---|---|---|
| Revenue | ₹3,777 Cr | +38.52% YoY |
| Net profit | ₹262 Cr | +28.96% YoY |
| EBITDA | ₹401 Cr | +28.69% YoY |
| EBITDA margin | 10.62% | -81 bps YoY |
| EBITDA margin | 10.62% | -242 bps QoQ |
Source: KEI Industries Q2 FY27 earnings presentation. Financial amounts are rounded as reported in the presentation; margins and growth rates are company-reported.
Revenue increased 18.56% sequentially, but EBITDA declined 3.46%, and net profit fell 4.26% compared with Q1 FY27.
The company’s standalone cost-of-goods-sold ratio increased to 78.19% from 75.23% in the previous quarter, indicating a higher cost burden relative to sales.
The key concern was therefore not weak demand but the gap between revenue expansion and operating profitability.
Wires and Cables Sales Remain Strong
KEI’s core wires and cables business continued to expand during the September quarter.
Domestic wires and cables sales increased 45.76% year-on-year to approximately ₹3,184 crore, while export sales grew 7.27% to around ₹455 crore.
Total wires and cables sales, including exports, reached approximately ₹3,639 crore, contributing 96.35% of quarterly revenue.
The company’s dealer and distributor sales also increased 50.46% year-on-year, contributing 58.79% of total sales compared with 54.12% a year earlier.
KEI reported a pending order book of approximately ₹5,185 crore.
These figures underline sustained business growth. However, the next test will be whether the company can protect margins as sales volumes expand and input costs fluctuate.
KEI Industries Futures: October and November OI Show Contrasting Trends
NiftyTrader’s expiry-wise futures data revealed a notable difference in open-interest movements during Thursday’s trading session.
At 12:27 PM IST on October 22, 2026, KEI’s spot price stood at ₹3,900, down 7.81% in the platform’s snapshot.
The October futures contract showed falling prices alongside a decline in open interest, while November futures recorded a sharp OI increase despite lower prices.
| Futures expiry | Futures price | Open interest | Reported OI change |
|---|---|---|---|
| October 27, 2026 | ₹3,899.10 | 23,36,075 | -1.23% |
| November 23, 2026 | ₹3,907.20 | 5,87,475 | +167.70% |
| December 29, 2026 | ₹3,975.00 | 20,650 | +55.26% |
Source: NiftyTrader KEI Futures, October 22, 2026, 12:27 PM IST. OI figures and changes are reproduced as displayed by NiftyTrader, not independently reconciled against NSE’s derivatives files. The displayed OI units and exact comparison baseline are not separately specified in the inspected snapshot.
What Does the October–November OI Divergence Indicate?
October futures were down 8.04% in NiftyTrader’s snapshot, while open interest declined 1.23%.
This price-and-OI combination is commonly described as long unwinding, indicating that outstanding positions decreased while futures prices fell.
November futures presented a different picture.
Their price was down 8.13%, but open interest increased 167.70%. NiftyTrader classified this combination as short buildup.
However, with October expiry approaching on October 27, the November OI increase requires careful interpretation.
The movement may reflect a combination of positions shifting into later expiries, fresh trading activity and hedging.
Rising November open interest alone does not establish that new bearish positions account for the entire increase. The reported figures also cannot identify whether institutional investors were responsible.
For F&O traders, this distinction matters because interpreting only the near-month contract could miss substantial positioning changes in the next-month series.
KEI Option Chain: PCR Below 1 Ahead of October Expiry
NiftyTrader’s KEI option-chain data, refreshed at 10:55 AM IST on October 22, showed an open-interest put-call ratio (PCR) of 0.7270 for the October 27 expiry.
The snapshot also showed the highest call open interest at the ₹4,300 strike and the highest put open interest at ₹3,800.
A PCR below 1 indicates greater aggregate call open interest than put open interest for the relevant option-chain calculation.
However, PCR is a positioning indicator, not a standalone directional forecast.
Call positions may represent outright trades, hedges or components of multi-leg strategies. Traders should therefore interpret the ratio alongside price action, changes in OI and the approaching expiry.
What Should KEI Industries Traders Watch Next?
KEI’s sharp post-earnings price reaction highlights the importance of operating margins alongside revenue and profit growth.
For equity investors, future margin performance, input costs, business expansion and execution of the order book remain important factors.
For F&O traders, the immediate event is the October 27, 2026 expiry.
Three developments merit attention: whether the share price stabilises after the earnings reaction, how October and November futures OI changes evolve, and whether options positioning shifts as expiry approaches.
The current data shows that KEI’s strong sales growth has not prevented a sharp market reaction to weaker profitability.
It also demonstrates why expiry-wise derivatives analysis is more informative than relying on a single futures OI figure.
Data note: Financial figures relate to Q2 FY27, ended September 30, 2026. The futures snapshot is from 12:27 PM IST on October 22, while the option-chain snapshot is from 10:55 AM IST. The 11.48% share-price fall refers to the NSE intraday low, not the closing decline. These are historical intraday observations, not end-of-day derivatives figures.
Read Next: NSE Lock-In Ends Today: 1.89 Crore Shares Unlock; Stock 4.4% Below IPO Price
Disclaimer: This article is for informational and educational purposes only and does not constitute investment advice or a recommendation to buy or sell securities or derivatives.