Key Takeaways
- Net profit fell 39% YoY to Rs 789 crore, missing the CNBC-TV18 poll estimate of Rs 923 crore
- Revenue rose just 2.3% YoY to Rs 7,119 crore, also below the Rs 7,342 crore Street estimate
- EBITDA margin contracted to 16.7% from 25.6%, as North America revenue fell 21% YoY
- India business posted its highest-ever quarterly revenue of Rs 3,452 crore, up 12% YoY
- Cipla shares slipped in Thursday’s trade, extending a soft run through 2026
Why Today?
Cipla’s stock is in focus on July 23, 2026, after the board approved Q1 FY27 results, the company’s first scorecard of the new fiscal year. Both profit and revenue missed CNBC-TV18 poll estimates, and margins narrowed sharply as North America continued to underperform. Investors are also watching management’s commentary on a sequential US recovery, against the backdrop of a proposed US generic drug tariff that reports suggest could take effect from 2028.
Cipla Q1 FY27: Key Numbers at a Glance
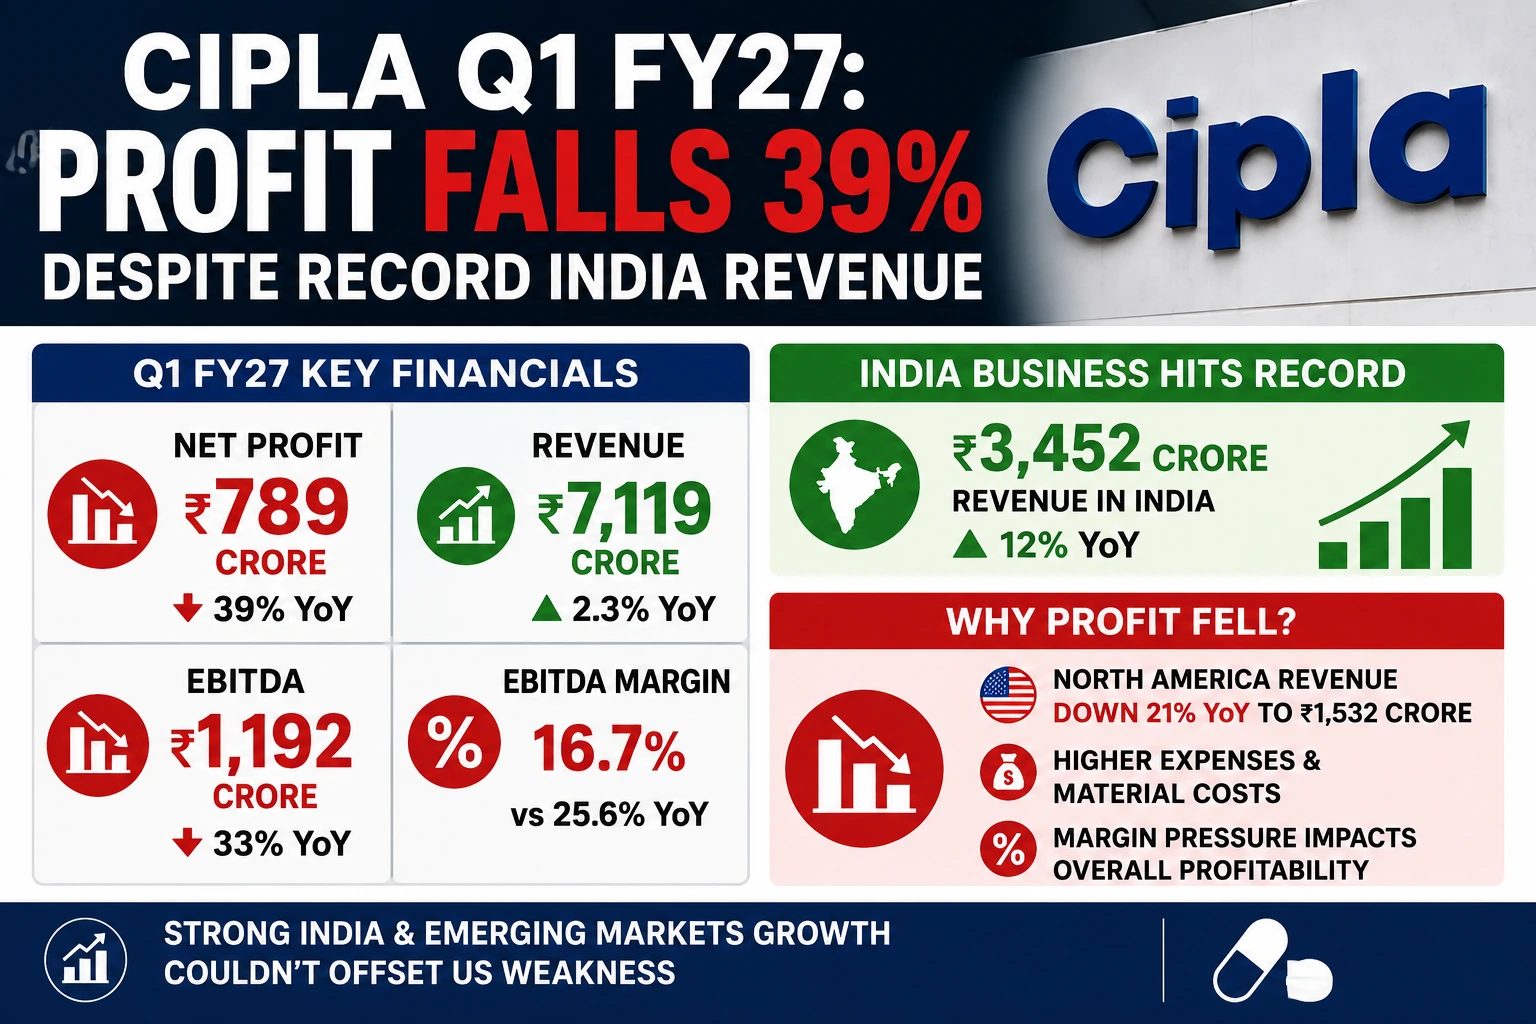
Revenue and profit both fell short of Street polls, Rs 923 crore on profit, Rs 7,342 crore on revenue, while EBITDA margin narrowed nearly nine percentage points as costs rose faster than sales. Sequentially, revenue was up 9% from Rs 6,541 crore in the March quarter, even as the year-on-year comparison disappointed.
| Metric | Q1 FY27 (Jun 2026) | Q1 FY26 (Jun 2025) | YoY Change |
|---|---|---|---|
| Net Profit | Rs 789 crore | Rs 1,298 crore | -39% |
| Revenue from Operations | Rs 7,119 crore | Rs 6,957 crore | +2.3% |
| EBITDA | Rs 1,192 crore | Rs 1,778 crore | -33% |
| EBITDA Margin | 16.7% | 25.6% | -890 bps |
| Total Expenses | Rs 6,248 crore | Rs 5,446 crore | +14.7% |
| Tax Expense | Rs 295 crore | Rs 478 crore | -38% |
| EPS | Rs 9.77 | Rs 16.07 | -39% |
Track Live: Cipla Share Price & Live Chart
Why Margins Cracked: Inside the Cost Story
The margin story is really a cost story. Material costs climbed to Rs 2,667 crore from Rs 2,171 crore, and employee expenses rose to Rs 1,497 crore from Rs 1,312 crore, pushing total expenses up 14.7% to Rs 6,248 crore even as revenue grew barely 2%.
Layered on top, R&D spending rose 12.3% YoY to Rs 486 crore (6.8% of revenue) as Cipla accelerated product filings, a deliberate investment, but one that further squeezed near-term profitability. The net effect: EBITDA margin gave back nearly nine percentage points in a single year.
North America: Still the Weak Link
The steepest hit came from North America, where revenue fell 21% YoY to Rs 1,532 crore ($162 million), missing the $173 million Street estimate and contributing roughly 22% of total revenue.
Cipla attributed the decline to shifting conditions in the US generics market, though management expects sequential improvement backed by newer launches, including gVentolin, Nintedanib and Dapagliflozin.
India Powers Ahead — Africa Numbers Still Being Verified
India remained the bright spot, delivering its highest-ever quarterly revenue of Rs 3,452 crore, up 12% from Rs 3,070 crore and now roughly 48% of the topline.
Growth was led by the branded prescription business, up 15.4%, on strength in respiratory, urology, cardiac and anti-diabetes therapies; the chronic portfolio mix improved to 60.4%.
Emerging Markets and Europe grew 16% in rupee terms (5% in USD).
One Africa posted revenue of Rs 977 crore for the quarter, we’re holding off on a YoY growth figure for this segment pending confirmation against Cipla’s official investor deck.
| Segment | Q1 FY27 Revenue | YoY Growth |
|---|---|---|
| India (One-India) | Rs 3,452 crore | +12% |
| North America | Rs 1,532 crore ($162 mn) | -21% |
| Emerging Markets & Europe | Rs 999 crore | +16% (+5% USD) |
| One Africa | Rs 977 crore | Figure pending confirmation |
Also Check: Nifty Pharma Index Today
What This Means for Investors
The quarter reinforces a pattern that’s held through much of FY26–27: India’s chronic-therapy franchise keeps compounding at a steady double-digit clip, while earnings volatility is increasingly a North America story.
Brokerages had flagged the North America drag ahead of results, citing pricing pressure and lower Revlimid contribution, and several have already trimmed Cipla’s FY27 earnings estimates even while flagging resilience in the India growth engine.
The stock’s underperformance this year reflects that tension, six-month returns remain roughly flat even as India delivers record quarters.
The near-term watchlist: whether gVentolin and Nintedanib ramp-ups deliver the sequential US recovery management is guiding to, and how the proposed 2028 US generic tariff eventually gets structured.
For More Check: Pharma Sector Earnings Tracker
Management Commentary & Outlook
MD and Global CEO Achin Gupta pointed to broad-based progress across focus markets, with India delivering strong double-digit growth even as North America remains a work in progress. Cipla’s balance sheet stayed healthy, with a net cash position of Rs 9,494 crore as of June 2026 (cash and equivalents of Rs 10,094 crore against total debt of just Rs 600 crore, mostly lease and working-capital related).
Cipla Share Price Today
Cipla shares were trading in the Rs 1,380–1,388 band on the NSE and BSE as of Thursday, down roughly 2.4% from the previous close of Rs 1,415.10, with the day’s range between Rs 1,373.60 and Rs 1,426.90. The stock remains well off its 52-week high of Rs 1,673 (52-week low: Rs 1,165.70).
Check Live: CIPLA Options Chart | Nifty Trader
NiftyTrader Desk View
| Stock | Key Technical Trigger | Trader View |
|---|---|---|
| Cipla | Trading near Rs 1,380–1,388, down ~2.4% from prior close of Rs 1,415.10; day’s range Rs 1,373.60–1,426.90 | Reacting to the earnings miss on profit, revenue and margin; price action stays well off the 52-week high of Rs 1,673 |
Disclaimer: This article is for informational purposes only and should not be construed as investment advice. Stock market investments are subject to market risks. Readers are advised to consult a registered financial advisor before making any investment decisions. Figures are based on the company’s regulatory filings and financial results as reported.