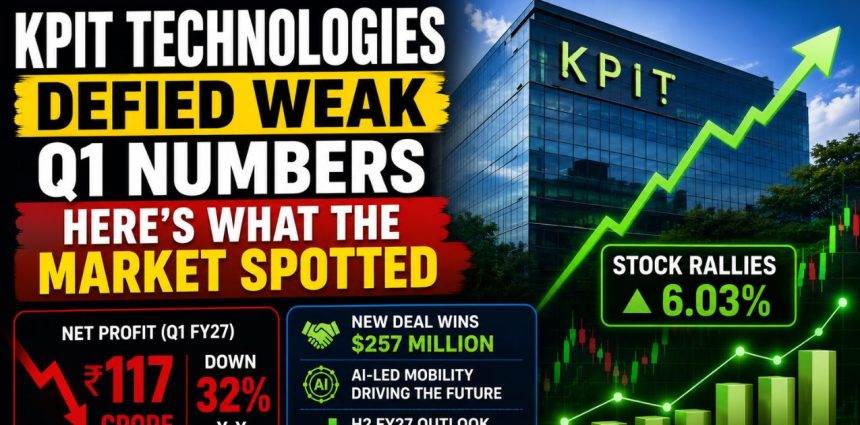
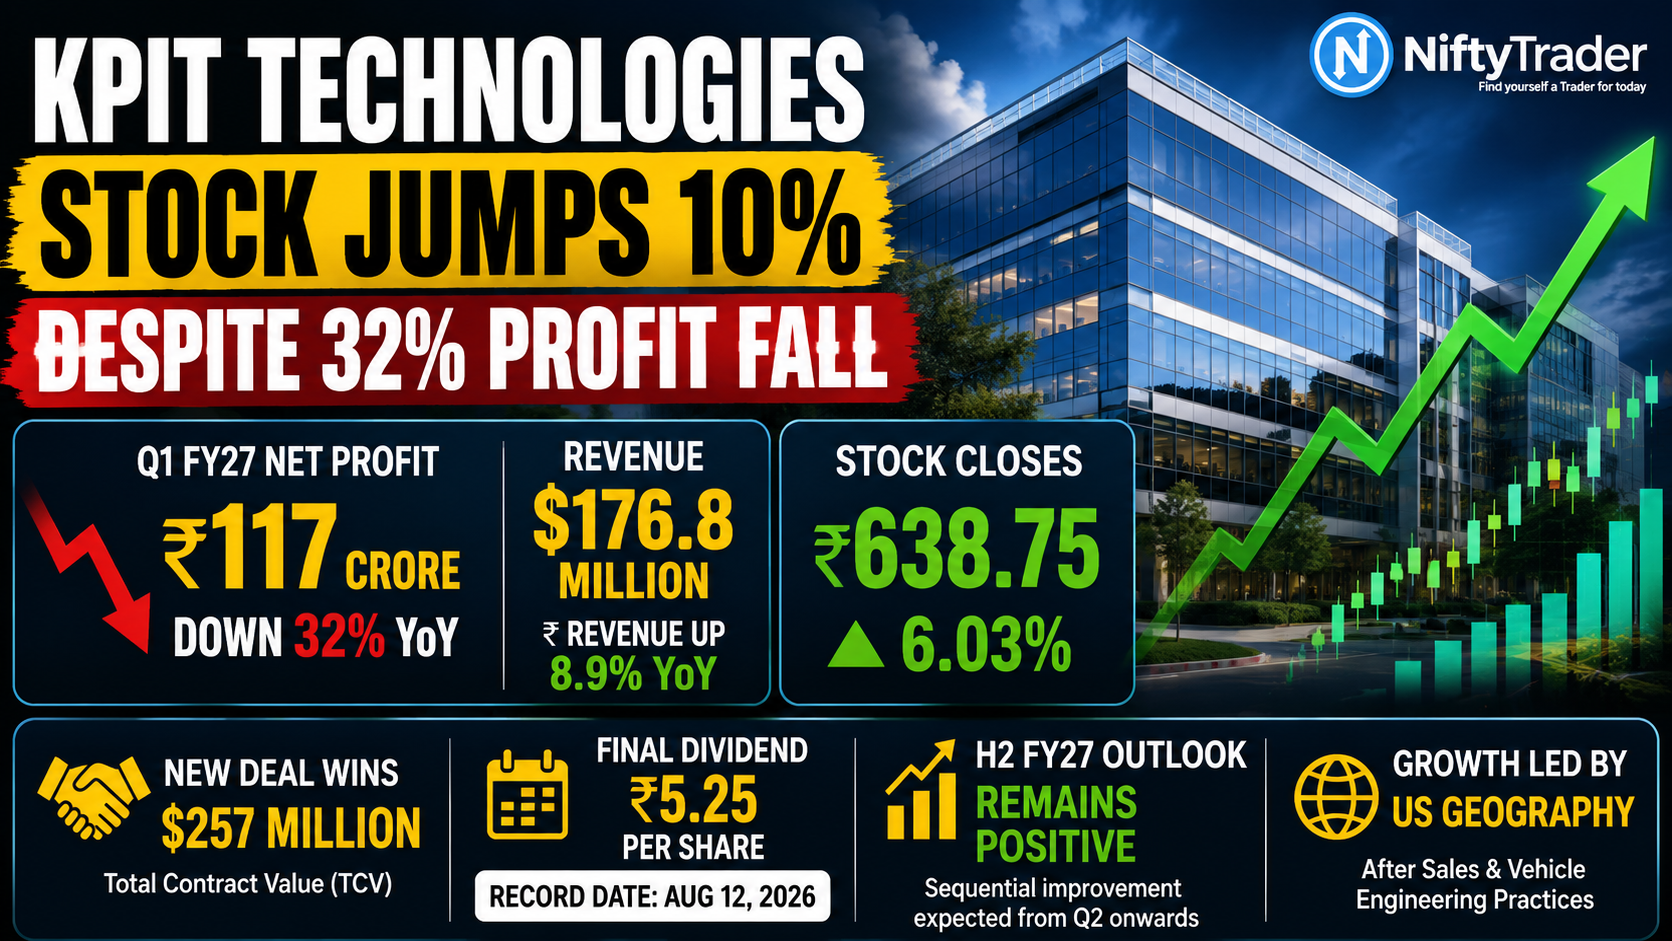
Pune-headquartered auto-engineering software firm KPIT Technologies gave the market a reaction few would have predicted on results day, its stock spiked as much as 10% intraday to touch Rs 662.65, before easing off to close the session up 6.03% at Rs 638.75, after a steep 32% year-on-year drop in quarterly profit. For a stock under pressure through most of 2026, even the pared-back closing gain stood out sharply.
The short answer: KPIT had already warned the Street this quarter would be ugly. When actual numbers landed only slightly less ugly than feared, that was enough to spark relief buying.
Check Live: KPIT TECHNOLOGIES Options Chart | Nifty Trader
The Headline Numbers From Q1 FY27
For the quarter ended June 30, 2026, KPIT Technologies reported consolidated net profit of roughly Rs 117 crore, down about 32% from Rs 172 crore in the same quarter last year. Revenue for the quarter came in at $176.8 million.
Here’s the nuance easy to miss: rupee revenue grew 8.9% year-on-year to around Rs 1,675 crore, but per the company’s own disclosure, that’s largely a currency effect, on a constant-currency basis, growth was just 0.1%, and in actual US dollar terms, revenue declined 0.6% year-on-year. The rupee “growth” owes more to a weaker currency than to real business expansion this quarter.
Sequentially, profit was down roughly 28% from Q4 FY26’s Rs 163 crore, and revenue slipped about 2% from Rs 1,711 crore. On profitability, KPIT confirmed EBITDA margin at 17.2% and EBIT margin at 12.3% — both down from a year-ago EBITDA margin of ~21%, as the revenue slowdown outpaced the company’s ability to trim costs in the short window available.
Why Did the Stock Rally on a Weak Profit Print?
Earlier in July, KPIT had flagged a “profit warning” of sorts, telling exchanges that sudden spending cuts by a few European auto OEMs, clients grappling with their own profit warnings, would hit Q1 revenue and margins harder than usual. That disclosure had already dragged the stock to 52-week lows.
So when actual results landed only marginally better than that gloomy internal outlook, it read to the market less as “profit crashed” and more as “things aren’t as bad as we feared.”
Management reiterated that a few large clients remain under pressure, but said its strategy of spreading growth across clients, geographies, mobility segments and offerings is starting to show resilience, with AI-linked offerings gaining traction across vehicle engineering, digital cockpit, autonomous technology and aftersales.
The $257 Million Silver Lining
One number likely explains why investors didn’t panic further: KPIT won new deals worth $257 million in total contract value (TCV) during the quarter, a sign the pipeline for automotive software work hasn’t dried up, even with pressure at a few large accounts. Growth during the quarter was led by the US geography, along with the After Sales and Vehicle Engineering & Design practices.
President and Joint MD Sachin Tikekar added that the near-term priority is disciplined execution across growth levers, deepening high-growth client accounts, building momentum in trucks and off-highway vehicles, adding new passenger-vehicle manufacturer ties, and strengthening capabilities in propulsion, diagnostics, cybersecurity and after-sales software alongside the AI-defined vehicle push.
Dividend Watch: Record Date and Payout
Alongside results, KPIT’s board recommended a final dividend of Rs 5.25 per share for FY26, with August 12, 2026 fixed as the record date, only shareholders holding the stock by then will qualify for the payout.
Also Check: KPIT TECHNOLOGIES Option Chain (NSE) — Live OI, PCR & Greeks
Stock Price Trend: A Rough Year, But Investors With a Longer Horizon Have Fared Better
The stock opened at Rs 610, swung between an intraday low of Rs 606.65 and a high of Rs 662.65, and finally settled at Rs 638.75 against the previous close of Rs 602.50, a closing gain of 6.03%, per BSE/NSE data. That’s the number that matters for anyone checking the price after market hours, even though the 10% figure that circulated in same-day reports reflected the day’s peak, not the close.
Zoom out on returns, and the picture turns mixed. Helped by today’s move, the stock is up 15.07% over the past week, but down 10.35% over the past month, 45.11% for 2026 so far, and 47.60% over one year.
Even the three-year return is negative (-40.41%), against a 35.02% gain for the Nifty 200. Only over five years does the stock lead, up 120.78% versus the index’s 67.23%. The 52-week range of Rs 543 (hit just two weeks ago) to Rs 1,328 shows how volatile the ride has been.
Notably, this print comes after a rough patch for brokerages too, multiple foreign and domestic houses had already trimmed ratings and targets through July on the guidance cut (see snapshot below). Whether any revise those calls upward after this “beat-the-lowered-bar” quarter is worth tracking over the next few sessions.
NiftyTrader Desk View
| Aspect | Desk Take |
|---|---|
| Near-term signal | Stock reaction reflects relief, not recovery — actual numbers are still weaker YoY across profit and margins |
| What to watch | Whether Q2 and H2 FY27 show the sequential improvement management is guiding for |
| Risk | Continued softness among large European OEM clients could keep pressure on margins |
| Dividend angle | Modest at current price; not the core reason to hold this stock |
(This section reflects NiftyTrader’s editorial analysis and should not be read as investment advice.)
Q1 FY27 Financial Snapshot
| Metric | Q1 FY27 | Q1 FY26 (YoY change) | Q4 FY26 (QoQ change) |
|---|---|---|---|
| Revenue (₹) | ~Rs 1,675 crore | Rs 1,539 crore (+8.9%) | Rs 1,711 crore (-2%) |
| Revenue (USD, CC) | $176.8mn | CC growth: +0.1%; USD: -0.6% | — |
| Net Profit | ~Rs 117 crore | Rs 172 crore (-32%) | Rs 163 crore (-28%) |
| EBITDA Margin | 17.2% | ~21% | Compressed sequentially |
| EBIT Margin | 12.3% | — | — |
| New Deal Wins (TCV) | $257 million | — | — |
| Final Dividend (FY26) | Rs 5.25/share | Record date: Aug 12, 2026 | — |
Track Here: KPIT TECHNOLOGIES Ltd Futures — Live Price, OI & Basis
KPIT Stock & Brokerage Snapshot
| Metric | Detail |
|---|---|
| Closing price (29 Jul 2026) | Rs 638.75 (+6.03%) |
| Intraday high (results day) | Rs 662.65 (+~10%) |
| Previous close | Rs 602.50 |
| 1-week return | +15.07% |
| 1-month return | -10.35% |
| 2026 YTD return | -45.11% |
| 1-year return | -47.60% |
| 3-year return | -40.41% |
| 5-year return | +120.78% |
| TTM P/E (consolidated) | 27.47x |
| 52-week range | Rs 543 (15-Jul-26) – Rs 1,328 (18-Sep-25) |
| Brokerage stance (pre-Q1 print) | Multiple downgrades/target cuts through July on guidance concerns |
Read Next: Asian Paints Q1: Margin Surprise Steals the Show Despite Volume Miss
Disclaimer: This article is for informational purposes only and does not constitute investment advice. Stock market investments are subject to market risks. Readers should conduct their own due diligence or consult a SEBI-registered financial advisor before making investment decisions. Figures are based on company disclosures and financial news reports as of July 29, 2026, and may be subject to revision.