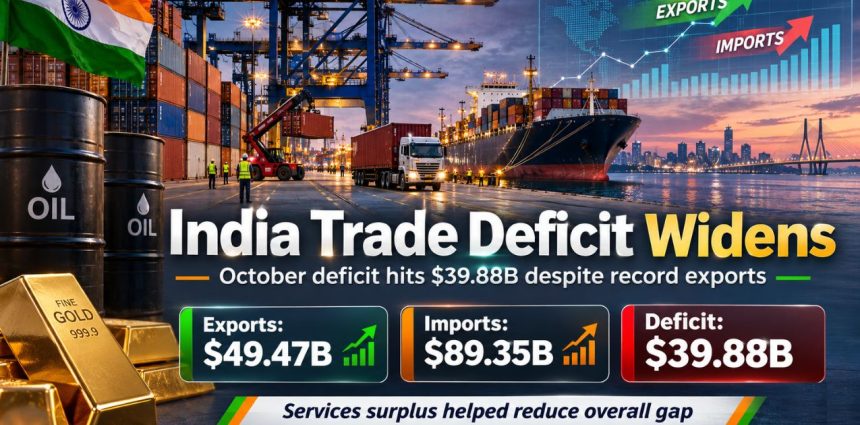
India Trade Deficit, November 14, 2026: India’s merchandise trade deficit widened to $39.88 billion in October 2026, as record imports of $89.35 billion outpaced record exports of $49.47 billion, according to Commerce Ministry data released on Friday, November 13.
The deficit increased from $30.21 billion in September and exceeded the $32.25 billion estimate in a Reuters poll of economists. However, it remained below the $42.58 billion deficit recorded in October 2025.
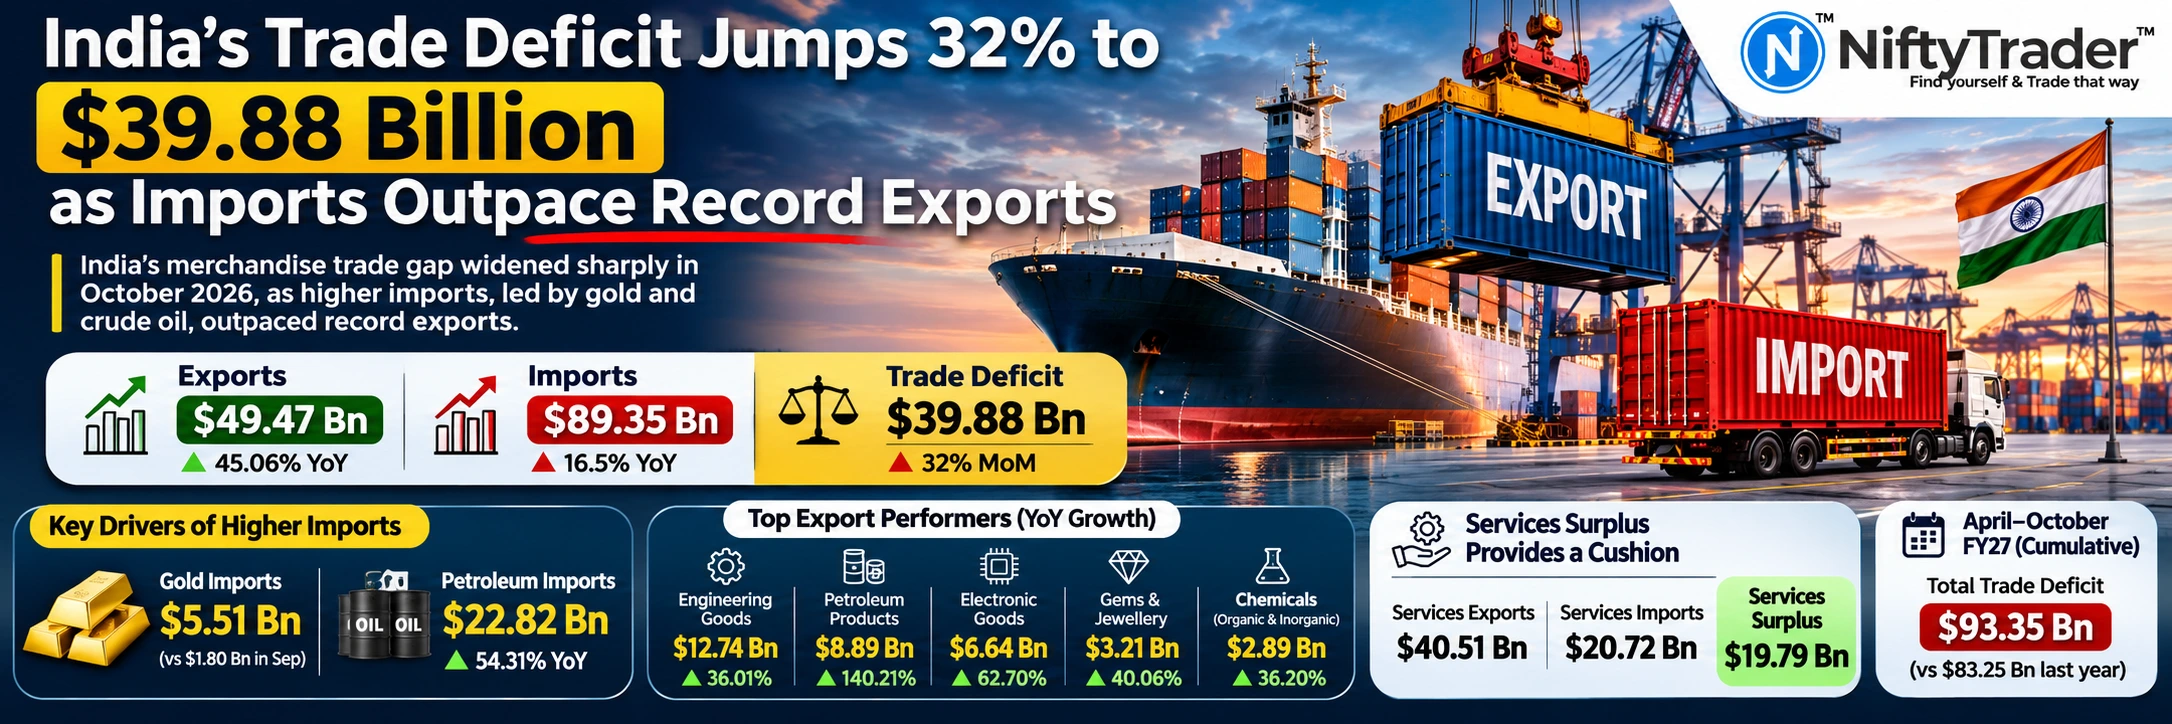
Merchandise exports increased approximately 45.06% year-on-year to $49.47 billion, while imports rose around 16.5% to $89.35 billion. The latest figures highlight the pressure from India’s import bill even as export performance reached a new monthly high.
India’s Trade Deficit Exceeds Economists’ Expectations
India’s merchandise trade deficit increased approximately 32% month-on-month to $39.88 billion in October from $30.21 billion in September.
The deficit exceeded the Reuters poll forecast of $32.25 billion by $7.63 billion. However, it was approximately 6.3% lower than the $42.58 billion recorded in October 2025, when the merchandise trade gap reached a record level.
On a month-on-month basis, merchandise imports increased approximately 19.7%, compared with an 11.4% rise in exports.
The faster increase in imports contributed to the wider trade gap despite the record export performance.
Gold and Petroleum Imports Drive the Higher Import Bill
Gold imports more than tripled month-on-month to $5.51 billion in October from $1.80 billion in September, supported by pre-Diwali purchases.
However, the year-on-year comparison presents a different picture. Gold imports fell approximately 62.57% from $14.72 billion in October 2025 to $5.51 billion in October 2026.
This distinction is important because the monthly increase in gold imports does not represent an annual increase in gold import expenditure.
Petroleum imports, meanwhile, increased 54.31% year-on-year to $22.82 billion in October. Higher energy costs and disruptions in global energy markets linked to the Middle East conflict contributed to the increase.
India imports nearly 85% of its crude oil requirements, leaving its external trade position sensitive to international energy prices.
Track Live: Gold Price Today in India | Crude Oil Prices
Petroleum, Electronics and Engineering Goods Lift Exports
Despite the wider merchandise trade deficit, India’s exports reached an all-time monthly high of $49.47 billion in October.
Commerce Ministry data showed strong year-on-year growth across several major export categories.
| Export category | October 2026 exports | YoY growth |
|---|---|---|
| Engineering goods | $12.74 billion | 36.01% |
| Petroleum products | $8.89 billion | 140.21% |
| Electronic goods | $6.64 billion | 62.70% |
| Gems and jewellery | $3.21 billion | 40.06% |
| Organic and inorganic chemicals | $2.89 billion | 36.20% |
Non-petroleum and non-gems-and-jewellery exports also increased to $37.38 billion in October from $28.11 billion a year earlier, representing growth of approximately 33%.
Commerce Secretary Rajesh Agrawal said exports to 43 of India’s top 50 export destinations recorded year-on-year growth during October.
The figures suggest that export growth extended across several sectors and overseas markets rather than being concentrated in a single category.
However, the record refers to export value and should not be interpreted as a 45% increase in physical shipment volumes.
Services Surplus Reduces India’s Overall Trade Deficit
The merchandise trade deficit does not represent India’s entire external trade position because the country also generates substantial revenue from services exports.
According to the Commerce Ministry’s October estimates, services exports stood at $40.51 billion, compared with services imports of $20.72 billion. This resulted in an estimated services trade surplus of $19.79 billion.
After including merchandise and services trade, the Ministry estimated India’s combined exports at $89.99 billion and imports at $110.07 billion.
The Commerce Ministry reported the combined goods-and-services trade deficit at approximately $20.09 billion in October, compared with $25.15 billion in October 2025.
This represents an improvement of approximately 20% year-on-year, providing an important counterbalance to the wider merchandise trade deficit.
However, October’s services trade figures are provisional estimates because the latest actual services-sector data released by the RBI was for September 2026.
India’s April-October Trade Deficit Continues to Widen
The cumulative trade figures for the first seven months of FY27 indicate continuing pressure on India’s overall external trade balance.
During April-October 2026-27, combined merchandise and services exports were estimated at $568.84 billion, registering growth of 16.66% over the corresponding period of the previous financial year.
Total imports increased 16% to $662.19 billion.
Consequently, the combined goods-and-services trade deficit widened to $93.35 billion during April-October 2026-27, compared with $83.25 billion in the corresponding period of the previous financial year.
The merchandise-only deficit also increased to $218.15 billion from $199.46 billion.
The cumulative figures suggest that strong export growth has not yet been sufficient to offset the increase in India’s overall import expenditure.
What India’s October Trade Data Means for Markets
The October trade figures present a mixed picture for the Indian economy.
Record merchandise exports and growth across multiple sectors indicate improving export performance. However, higher petroleum imports and the increase in the monthly merchandise trade deficit remain important concerns.
For currency markets, sustained increases in crude oil prices could raise India’s import bill and add pressure to the external payments position and the rupee.
The estimated services surplus provides a cushion, but the sustainability of export growth and the movement in global energy prices will remain important monitorables.
The latest figures do not establish an immediate direction for the rupee or equity markets, but they highlight the external risks facing the economy.
Also Check: USD/INR Exchange Rate
Bottom Line
India’s merchandise trade deficit widened to $39.88 billion in October, approximately 32% higher than September, despite record merchandise exports of $49.47 billion. Higher petroleum imports and the month-on-month recovery in gold imports contributed to the larger import bill.
However, gold imports remained significantly lower year-on-year, while the estimated services surplus helped narrow the overall goods-and-services trade deficit to approximately $20.09 billion.
The key question for the coming months is whether India’s export growth can sustain its momentum while containing the impact of higher energy imports on the country’s external trade balance.
Read Next: Meesho Block Deal: SoftBank Sells ₹1,885 Crore Stake; Fidelity Leads Buyers
Disclaimer: This article is for informational purposes only and is based on official government data and publicly available reports. Trade figures, particularly services estimates, may be revised. The content does not constitute financial or investment advice.