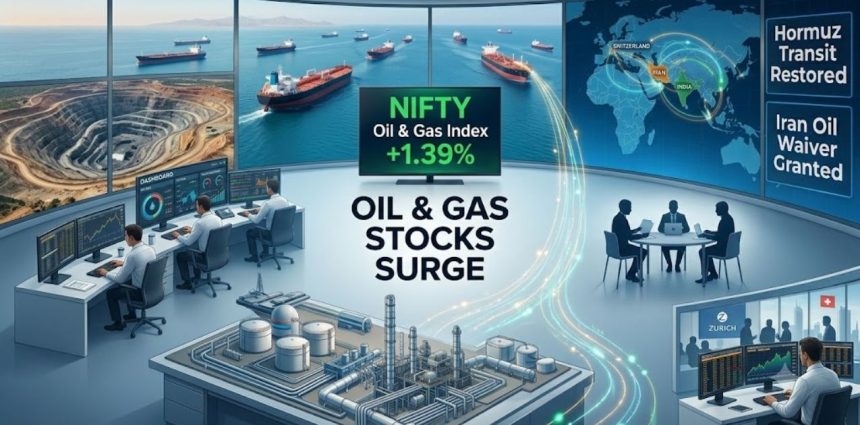
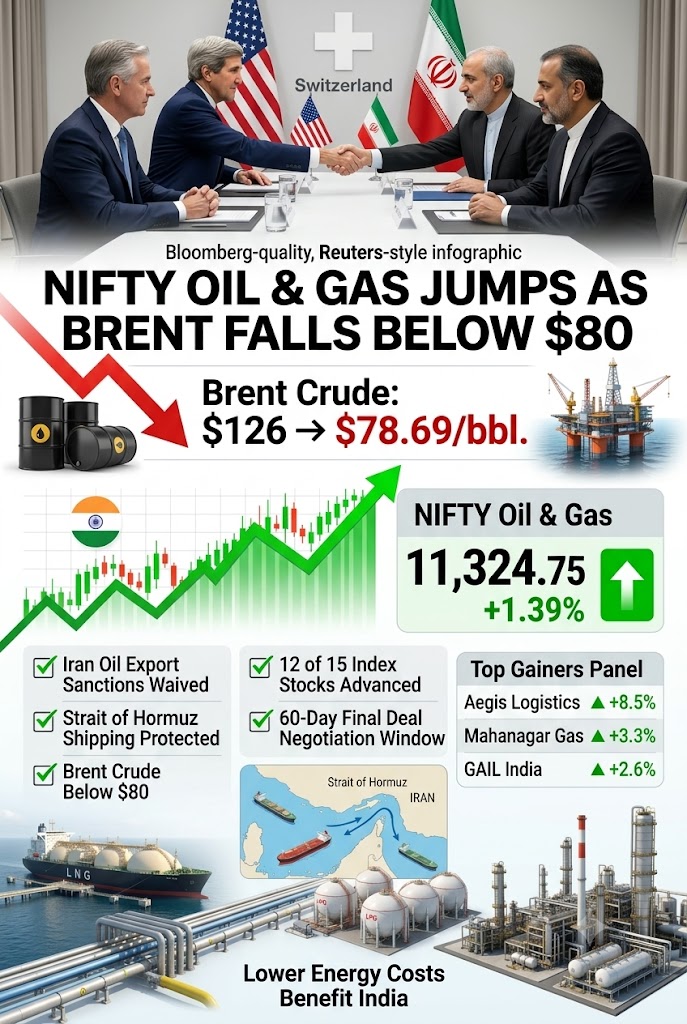
The NIFTY Oil & Gas index surged to an intraday high of 11,324.75, up 1.39%, on Monday, June 22, after Iran’s Foreign Minister Abbas Araghchi confirmed the country had secured sanctions waivers on oil and petrochemical exports following the conclusion of the first round of US-Iran technical talks in Bürgenstock, Switzerland, as reported by Reuters and CNN.
Brent crude for August delivery dropped as low as $78.69 per barrel by midday, down 2.33% from the previous session’s close of $80.57, with 12 of the index’s 15 constituents advancing. By 12:09 PM IST the index had settled at 11,282.40, up 1.01%.
What the Switzerland Talks Actually Delivered
The US-Iran negotiations concluded in a “positive and constructive atmosphere,” according to a joint statement issued by mediators Qatar and Pakistan, a notably upbeat verdict after Trump’s threatening Truth Social posts nearly derailed the talks mid-session.
Iran’s Foreign Minister Abbas Araghchi confirmed that sanctions on Iran’s oil and petrochemical exports had been waived, some of its frozen assets abroad released, and a major reconstruction and development plan for Iran launched.
Mediators Pakistan and Qatar said both sides also agreed to establish a High-Level Committee to provide political oversight on the mediation process, with negotiators heading groups focused on nuclear issues, sanctions, and implementation.
The part that moved Indian energy markets most directly: the US and Iran agreed that ships must be allowed to pass safely through the Strait of Hormuz, with a “communication line” established between the parties specifically to avoid incidents and miscommunication affecting commercial vessel transit.
Under the terms of the memorandum of understanding, Washington granted immediate sanctions waivers for Iran’s fossil fuel sector.
A senior US official separately told CNBC that Iran can only retain the benefits of the agreement if it abides by its commitments, including not pursuing a nuclear weapon, neutralising enriched uranium, and not interfering with Hormuz traffic.
The interim MOU gives negotiators a 60-day window to reach a final agreement, which can be extended.
It also includes a framework for at least $300 billion in reconstruction and economic development if a final deal is secured, per the US-read version of the MOU text. Iranian officials have yet to formally confirm the US version.
Brent Crude: From $126 to $79 — The Full Price Picture
The collapse in Brent crude prices over the past two weeks reflects one of the sharpest geopolitical risk unwinds in oil market history.
At the peak of the crisis, Brent crude reached $126 per barrel, the largest monthly increase in oil prices on record, as Iran closed the Strait of Hormuz to Western-allied shipping from March 4, 2026, effectively halting a waterway through which 20 million barrels of oil pass every day, equivalent to roughly 20% of global petroleum liquids consumption.
Brent Crude Price: Key Levels During the Iran-US Conflict
| Date | Event | Brent Price |
|---|---|---|
| Feb 27, 2026 | Day before US-Israel strikes on Iran | ~$71/bbl |
| Mar 8, 2026 | Strait of Hormuz effectively closed | $100/bbl+ |
| Mar 2026 peak | Highest level during conflict | ~$126/bbl |
| Jun 16, 2026 | Iran oil sanctions waiver announced | $78.96/bbl |
| Jun 19, 2026 | Switzerland talks postponed; Brent recovers | $80.57/bbl |
| Jun 22, 2026 (intraday low) | Post-talks deal confirmed | $78.69/bbl |
Source: CNBC, Reuters, Wikipedia, Bloomberg
PVM Oil Associates analyst Tamas Varga noted that Brent fell by $17 per barrel across just four trading sessions last week, a direct “vote of confidence that the worst, at least as far as supply disruptions are concerned, is behind us,” as quoted by Al Jazeera.
That said, Vandana Hari of Singapore-based Vanda Insights cautioned that crude’s slide is “entirely sentiment-driven,” with markets front-running the prospective reopening of the Strait of Hormuz and pricing in the best-case scenario, meaning potential hiccups from logistics to renewed geopolitical tensions are not being adequately factored in.
NIFTY Oil & Gas: Top Movers on June 22
The rally was broad-based across downstream, logistics, and city gas distribution stocks. Aegis Logistics was the standout, printing a fresh 52-week high.
NIFTY Oil & Gas Index — Top Gainers (June 22, 2026, NSE)
| Stock | Intraday High | Change (%) | Prev Close | 12:09 PM Price |
|---|---|---|---|---|
| Aegis Logistics | ₹1,093.55 (52-wk high) | +8.50% | ₹1,007.80 | ₹1,066.25 (+5.80%) |
| Mahanagar Gas | ₹1,248.90 | +3.30% | ₹1,209.00 | ₹1,237.70 (+2.37%) |
| GAIL (India) | ₹178.47 | +2.63% | ₹173.90 | ₹178.10 (+2.42%) |
Source: NSE, Upstox | Data as of 12:09 PM IST, June 22, 2026
Aegis Logistics handles LPG and liquid bulk terminals, assets that are direct beneficiaries when Gulf shipping lanes normalise and LPG import economics improve. That explains why it led the index rather than a large OMC.
Mahanagar Gas and GAIL moved for a different reason. City gas distributors source LNG and piped gas at prices that track international spot LNG markets, which in turn track crude.
GAIL, India’s largest gas transporter, has LNG sourcing commitments where lower global spot prices directly improve margins on spot portfolio volumes.
Check Live:
Nifty Oil & Gas Sector — Live Performance & Stocks
GAIL (INDIA) Share Price Chart: Live
Why Gas Utilities Beat OMCs — The Less-Obvious Angle
Oil marketing companies like BPCL, HPCL, and IOC should logically benefit from falling crude costs, lower input prices improve refining margins. But the more structurally interesting story today is in the gas distribution names.
India has already resumed buying Iranian crude and LPG after a seven-year hiatus, with Indian refiners securing supplies from Iran following a US waiver allowing such purchases.
The Indian Ministry of Petroleum and Natural Gas confirmed that refiners faced no payment hurdles for Iranian crude. Meanwhile, about 50% of India’s total crude oil imports and most of its LPG, the primary cooking fuel for Indian households, passes through the Strait of Hormuz.
The average price of the Indian crude basket had surged from $69 per barrel in February 2026 to $113 per barrel in March 2026, representing a steep rise in procurement costs that squeezed refiner economics for months.
The partial reversion toward $79 on the Iran deal, if sustained, meaningfully improves the cost base for India’s entire downstream sector.
India had stopped importing Iranian crude in 2019 to comply with US sanctions. With waivers now reinstated and the Strait of Hormuz reopening, Indian refiners are positioned to resume access to Iranian barrels, which historically traded at discounts of $5–8 per barrel to Brent benchmarks, offering a procurement cost advantage for refiners that have coking capacity aligned to heavier Iranian grades.
Also Read: Crude Oil Holds Near $80 as US-Iran Talks Slip — What this Means for India’s Markets
The 60-Day Countdown: What Investors Must Watch
The next 60 days are not a holding pattern, they are an active negotiation window with defined tripwires that could reverse everything markets have priced in today.
The interim deal between the US and Iran calls for toll-free travel through the Strait of Hormuz for 60 days, with the US threatening to impose American tolls in the strait if a final agreement with Iran is not reached within that period.
The Lebanon-Hezbollah thread is the most likely flashpoint. Trump posted on Truth Social that Iran “must immediately stop their highly paid PROXIES in Lebanon from causing trouble,” threatening to “hit Iran very hard again.”
A resumption of Iranian-backed Hezbollah attacks on Israel, or any incident in the Strait involving an IRGC vessel, would directly test the ceasefire clause and likely spike crude prices again within 24 hours.
The 60-day deadline falls around August 21, 2026. Any signed final agreement before then, covering Iran’s nuclear program, sanctions architecture, and regional ceasefire terms, would represent a structural, not just sentiment-driven, downward shift in crude prices.
That scenario is materially better for Indian OMC margins, LPG import costs, and the NIFTY Oil & Gas index than what is currently priced.
Check Live: FII DII Data Today: NSE/BSE Cash & F&O Activity
Disclaimer: This article is for informational purposes only and does not constitute investment advice. Please consult a SEBI-registered financial advisor before making any investment decisions.