
Mutual Fund Flows Split in June: Equity Investors Return as Debt Funds Bleed ₹1.09 Lakh Crore
Retail investors are buying equities again—but why are over ₹1 lakh crore being pulled out of debt mutual funds at the same time? The latest AMFI data reveals a surprising shift in investor behaviour that could influence market trends in the coming months. Here’s what every investor should know before making the next investment decision.
Equity Mutual Fund Inflows Rise as Investor Sentiment Improves
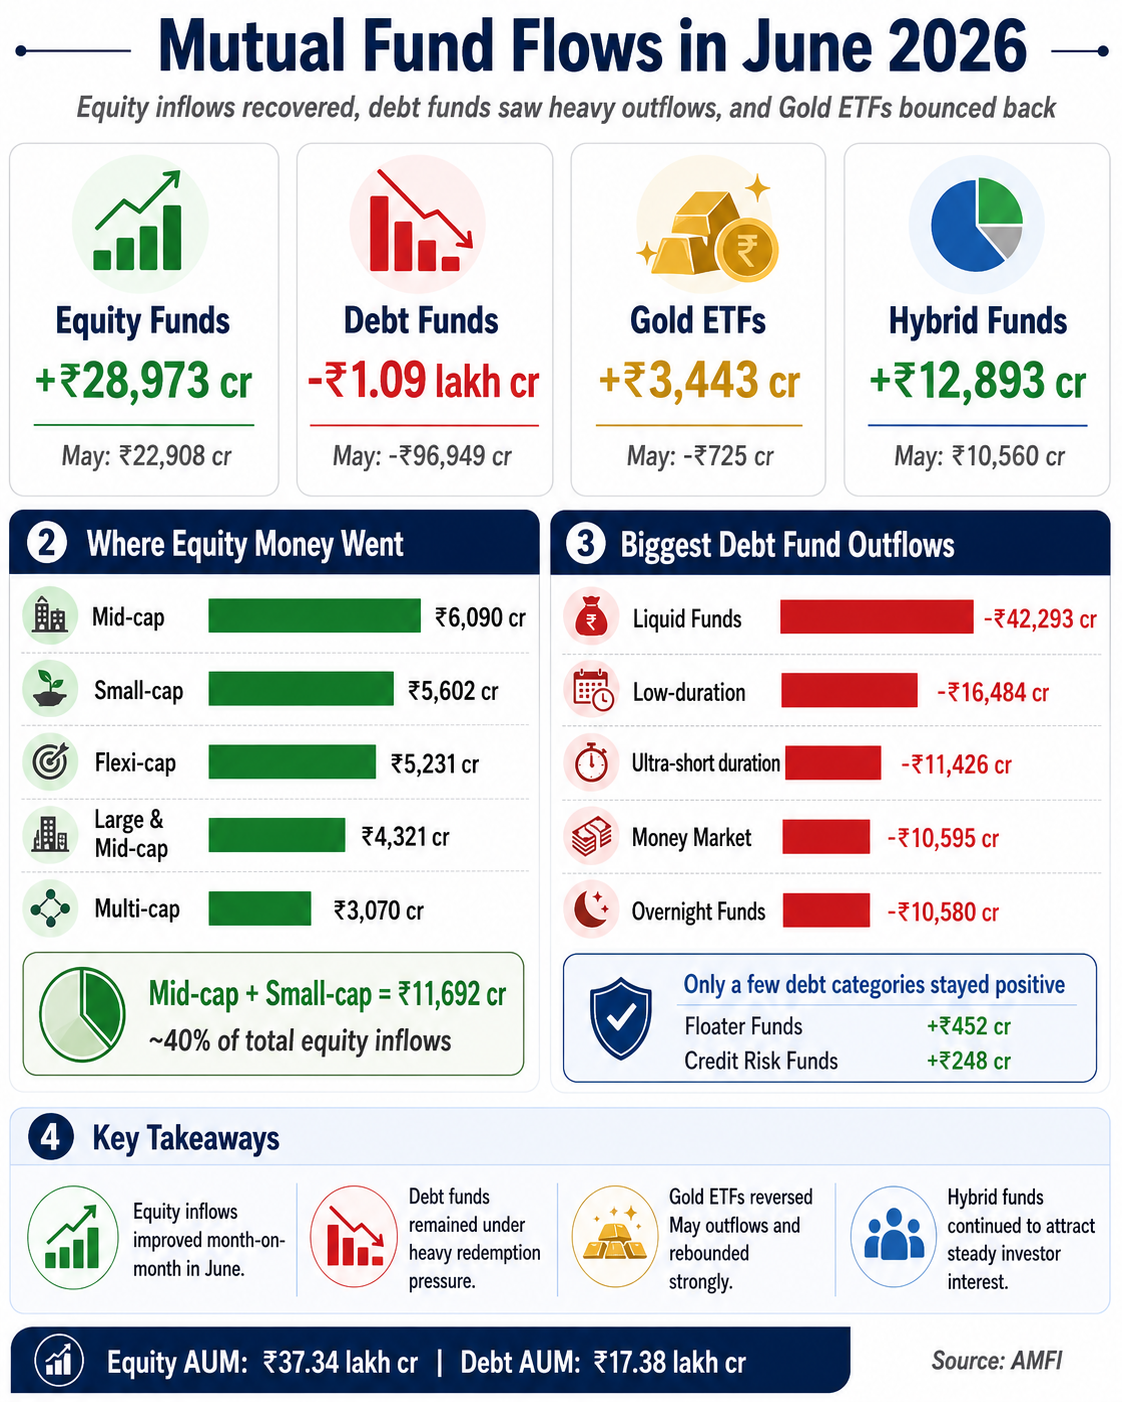
Equity mutual fund inflows recovered strongly in June 2026, with investors pouring ₹28,973 crore into equity schemes, up from ₹22,908 crore in May, according to AMFI.
The recovery suggests improving confidence among retail investors after a softer previous month. However, inflows remained below March and April levels, when equity mutual fund inflows crossed ₹38,000-40,000 crore.
At the same time, equity mutual fund AUM increased to ₹37.34 lakh crore, compared with ₹36.14 lakh crore in May.
Mid-Cap and Small-Cap Funds Continue to Lead Equity Mutual Fund Inflows
Investor preference remained concentrated in growth-oriented categories.
- Mid-cap funds: ₹6,090 crore
- Small-cap funds: ₹5,602 crore
- Flexi-cap funds: ₹5,231 crore
- Large & Mid-cap funds: ₹4,321 crore
- Multi-cap funds: ₹3,070 crore
Together, mid-cap and small-cap funds attracted nearly ₹11,692 crore, accounting for over 40% of total equity mutual fund inflows in June.
Large-cap funds also witnessed stronger buying, while sectoral and thematic funds more than doubled their inflows from May.
Monthly Flow of Mutual Funds (Rs cr)
| Category | June 2026 | May 2026 | Apr-25 |
|---|---|---|---|
| Equity | 28,973.41 | 22,907.77 | 38440.2 |
| Debt | -1,09,053.65 | -96,948.51 | 247490.03 |
| Hybrid | 12,892.76 | 10,560.24 | 20565.24 |
| Other schemes | 16,724.26 | 361.99 | 20082 |
| Solution-oriented schemes | 320.87 | 270.36 | 306.98 |
| Closed-ended and interval schemes | -2794.39 | -1,155.53 | -4467.31 |
| Total | 56,116.91 | -64,003.68 | 322,417.14 |
Source: Moneycontrol
Debt Mutual Fund Outflows Cross ₹1.09 Lakh Crore Again
While equity mutual fund inflows improved, debt mutual fund outflows remained severe.
Investors withdrew ₹1.09 lakh crore from debt schemes during June after pulling out ₹96,949 crore in May. Debt fund AUM also slipped to ₹17.38 lakh crore.
The biggest outflows came from:
- Liquid Funds: ₹42,293 crore
- Low Duration Funds: ₹16,484 crore
- Ultra Short Duration Funds: ₹11,426 crore
- Money Market Funds: ₹10,595 crore
- Overnight Funds: ₹10,580 crore
Only Floater Funds and Credit Risk Funds managed to attract fresh investments.
Hybrid Mutual Funds Continue to Attract Fresh Money
Hybrid funds remained a favourite among investors despite weakness in debt funds.
Net inflows rose to ₹12,893 crore in June from ₹10,560 crore in May.
Arbitrage Funds attracted ₹5,799 crore, while Multi Asset Allocation Funds received ₹4,811 crore, together contributing more than 80% of total hybrid inflows.
Monthly flow of equity oriented schemes (Rs cr)
| Category | June 2026 | May 2026 | Apr-25 |
|---|---|---|---|
| Multi-cap funds | 3,070.26 | 2,291.01 | 3,806.01 |
| Large-cap funds | 2,067.48 | 1,592.93 | 2,524.61 |
| Large- and mid-cap funds | 4,321.32 | 3,278.22 | 4,490.49 |
| Mid-cap funds | 6,090.17 | 4,385.06 | 6,551.40 |
| Small-cap funds | 5,601.96 | 4,945.57 | 6,885.90 |
| Dividend yield funds | -49.44 | -97.46 | -20.58 |
| Value funds/contra funds | 686.79 | 509.57 | 1,478.08 |
| Focused funds | 1,118.18 | 830.25 | 1,194.80 |
| Sectoral/thematic funds | 1,469.26 | 647.87 | 1,949.36 |
| ELSS funds | -633.88 | -650.78 | -567.73 |
| Flexi-cap funds | 5,231.31 | 5,175.54 | 10,147.85 |
| Total | 28,973.41 | 22,907.78 | 38,440.20 |
Source: Moneycontrol
Gold ETFs Make a Strong Comeback
One of the biggest surprises in the latest AMFI June 2026 data was the sharp recovery in Gold ETF inflows.
After witnessing ₹725 crore in outflows during May, Gold ETFs attracted ₹3,443 crore in June.
The rebound indicates that investors are once again adding gold to diversify portfolios amid global uncertainties.
Industry Expert Explains the Bigger Picture
Commenting on the latest numbers, Aditya Agarwal, Co-founder of Wealthy.in, said:
“AMFI’s June 2026 data shows total mutual fund AUM at ₹82.22 lakh crore and total folios at 27.86 crore. However, the headline outflow was largely driven by debt-oriented schemes.”
He further added:
“Debt-oriented schemes alone saw net outflows of ₹1.09 lakh crore. In contrast, equity schemes received ₹28,973 crore, hybrid funds ₹12,893 crore and other schemes, including ETFs, ₹16,724 crore.”
Monthly flow trend of income-/debt-oriented schemes (Rs crore)
| Category | June 2026 | May 2026 | Apr-25 |
|---|---|---|---|
| Overnight funds | -10,579.58 | -15,524.77 | 31,420.45 |
| Liquid funds | -42,293.29 | -29,680.94 | 165,104.67 |
| Ultra-short-duration funds | -11,426.26 | -1,617.01 | 15,651.87 |
| Low-duration funds | -16,484.01 | -9,400.49 | 7,093.26 |
| Money market funds | -10,595.39 | -24,691.74 | 20,642.59 |
| Short-duration funds | -5,887.18 | -3,887.05 | 3,917.21 |
| Medium-duration funds | -243.27 | -263.30 | -392.22 |
| Medium- to long-duration funds | -766.36 | -229.03 | -157.72 |
| Long-duration funds | -719.75 | -896.71 | -727.19 |
| Dynamic bond funds | -961.46 | -653.69 | -704.60 |
| Corporate bond funds | -7,557.33 | -7,009.94 | 6,196.51 |
| Credit risk funds | 247.55 | 49.46 | 1,317.68 |
| Banking and PSU funds | -1,041.43 | -760.34 | -693.89 |
| Gilt funds | -1,095.55 | -1,683.60 | -1,048.49 |
| Gilt funds with 10-year constant duration | -102.48 | -298.76 | -149.27 |
| Floater funds | 452.14 | -400.62 | 19.17 |
| Total | -1,09,053.65 | -96,948.53 | 247,490.03 |
Source: Moneycontrol
What does the June AMFI data mean for the stock market?
The June 2026 AMFI data sends a constructive signal for the Indian stock market. While equity mutual fund inflows recovered from May’s one-year low rather than returning to the record levels seen earlier this year, the data reinforces the broader trend of strong domestic participation that has supported Indian equities for more than five years. Equity funds recorded their 64th consecutive month of net inflows, while SIP contributions climbed to a three-month high, underscoring the resilience of retail investors.
1. Strong Domestic Liquidity Supports Equity Markets
The rebound in equity mutual fund inflows to ₹28,973 crore indicates that domestic investors continued buying Indian equities despite recent volatility. Fresh inflows provide fund managers with deployable capital, helping support stock prices and market liquidity.
Market Impact
- Stronger domestic buying can cushion market corrections.
- Mutual fund inflows continue to reduce India’s dependence on foreign institutional investors (FIIs).
- Stable domestic liquidity improves overall market resilience during periods of global uncertainty.
2. Indian Markets Are Becoming More Resilient
The June data reinforces a structural shift in household savings from traditional assets toward equities.
Why this matters
- Equity mutual funds have now recorded 64 consecutive months of net inflows, highlighting sustained retail participation.
- Domestic Institutional Investors (DIIs) now have greater capacity to absorb heavy FII selling.
- Consistent SIP inflows create a natural demand base, reducing the impact of external market shocks.
3. Mid- and Small-Cap Stocks Continue to Attract Investors
Investor appetite for growth-oriented companies remains strong.
- Mid-cap funds attracted ₹6,090 crore.
- Small-cap funds received ₹5,602 crore.
- Together, these categories accounted for ₹11,692 crore, or just over 40% of total equity inflows.
What it means
- Fund managers are likely to continue deploying fresh money into mid- and small-cap stocks.
- Liquidity support could help sustain valuations, although investors should remain mindful of elevated valuations in some pockets.
4. Market Breadth Remains Healthy
Investor participation is not limited to one segment.
Besides mid- and small-cap funds:
- Flexi-cap funds attracted ₹5,231 crore.
- Large & Mid-cap funds received ₹4,321 crore.
- Large-cap fund inflows improved to ₹2,067 crore.
This diversified allocation suggests confidence across multiple market segments rather than a narrow rally concentrated in index heavyweights.
5. Debt Fund Outflows Don’t Signal Panic
The ₹1.09 lakh crore outflow from debt funds may appear alarming, but it is largely viewed as a result of institutional cash management rather than a loss of confidence in financial markets.
The largest withdrawals came from:
- Liquid funds
- Low-duration funds
- Ultra-short-duration funds
- Overnight funds
- Money market funds
Such movements often coincide with corporate treasury requirements, including advance tax payments and quarterly liquidity management. Similar cash typically returns to short-term debt funds in subsequent months.
6. Gold ETFs Reflect Cautious Diversification
Gold ETFs staged a strong recovery, attracting ₹3,443 crore after recording outflows in May.
This suggests investors are:
- Increasing portfolio diversification.
- Building hedges against geopolitical uncertainty and inflation.
- Balancing equity exposure rather than exiting risk assets altogether.
7. Hybrid Funds Highlight a Balanced Investment Approach
Hybrid funds received ₹12,893 crore in net inflows.
Arbitrage and multi-asset allocation funds accounted for the majority of these investments, indicating that investors continue to seek exposure to equities while managing volatility through diversified portfolios.
What Impact Could This Have on the Stock Market?
The recovery in equity mutual fund inflows is positive for Indian equities because steady domestic buying provides support whenever foreign institutional investors turn volatile.
Continued inflows into mid-cap, small-cap, and flexi-cap funds could help these segments remain resilient. However, rich valuations mean investors should continue investing through SIPs instead of chasing rallies.
Persistent debt mutual fund outflows may temporarily reduce demand in fixed-income products, while higher allocations to Gold ETFs reflect cautious optimism rather than aggressive risk-taking.
What Should Investors Watch Next?
The June mutual fund inflows data suggests that retail investors are still backing India’s equity markets despite global uncertainties.
If equity mutual fund inflows remain above ₹25,000 crore in the coming months while corporate earnings stay strong, domestic liquidity could continue supporting broader market sentiment. Investors should also monitor upcoming quarterly earnings, FII activity and interest-rate expectations, as these factors are likely to influence both equity and debt mutual fund flows in the months ahead.
Track Live : NSE Option Chain
Stocks and Sectors Likely to Benefit from June Mutual Fund Inflows
- Capital Goods – Benefiting from India’s infrastructure and capex cycle.
- Defence & Aerospace – Supported by rising government spending and localization initiatives.
- Power & Utilities – Driven by renewable energy investments and grid modernization.
- Infrastructure & Construction – Continued public infrastructure spending supports order books.
- Manufacturing & Industrials – Backed by the Production-Linked Incentive (PLI) scheme and domestic manufacturing expansion.
- Banking & Financial Services – Large private banks remain core holdings across diversified mutual fund portfolios.
- Digital & Technology – Select technology and digital businesses continue attracting long-term institutional capital.
| Stock | Sector | Current Price (₹)* | 52-Week High (₹) | 52-Week Low (₹) |
|---|---|---|---|---|
| Larsen & Toubro (L&T) | Capital Goods | 3278.20 | 4,440.00 | 3,288.10 |
| Siemens India | Industrial Manufacturing | 3,489.20 | — | — |
| Bharat Electronics (BEL) | Defence | 414.85 | 473.45 | 361.20 |
| HDFC Bank | Banking | 824.95 | 1,020.35 | 726.65 |
| ICICI Bank | Banking | 1401.20 | 1,494.10 | — |
| Reliance Industries | Energy & Diversified | 1307.80 | — | — |