
Mutual Fund Inflows Surge as Debt Adds Rs 1.88 Lakh Crore, Small-Caps Lead
The Indian mutual fund industry made a dramatic turnaround in July, but the headline number hides a more interesting shift. Mutual fund inflows jumped to Rs 2.36 lakh crore, yet equity mutual fund inflows fell nearly 15% as investors became more selective about where they put fresh money.
The biggest surprise came from debt funds. Their sharp reversal from heavy outflows in June accounted for most of the industry’s turnaround.
For equity investors, however, the July AMFI data tells a different story: small-cap and mid-cap funds continued to attract money, while large-cap funds slipped into outflows.
Track Live : NSE Option Chain — Live
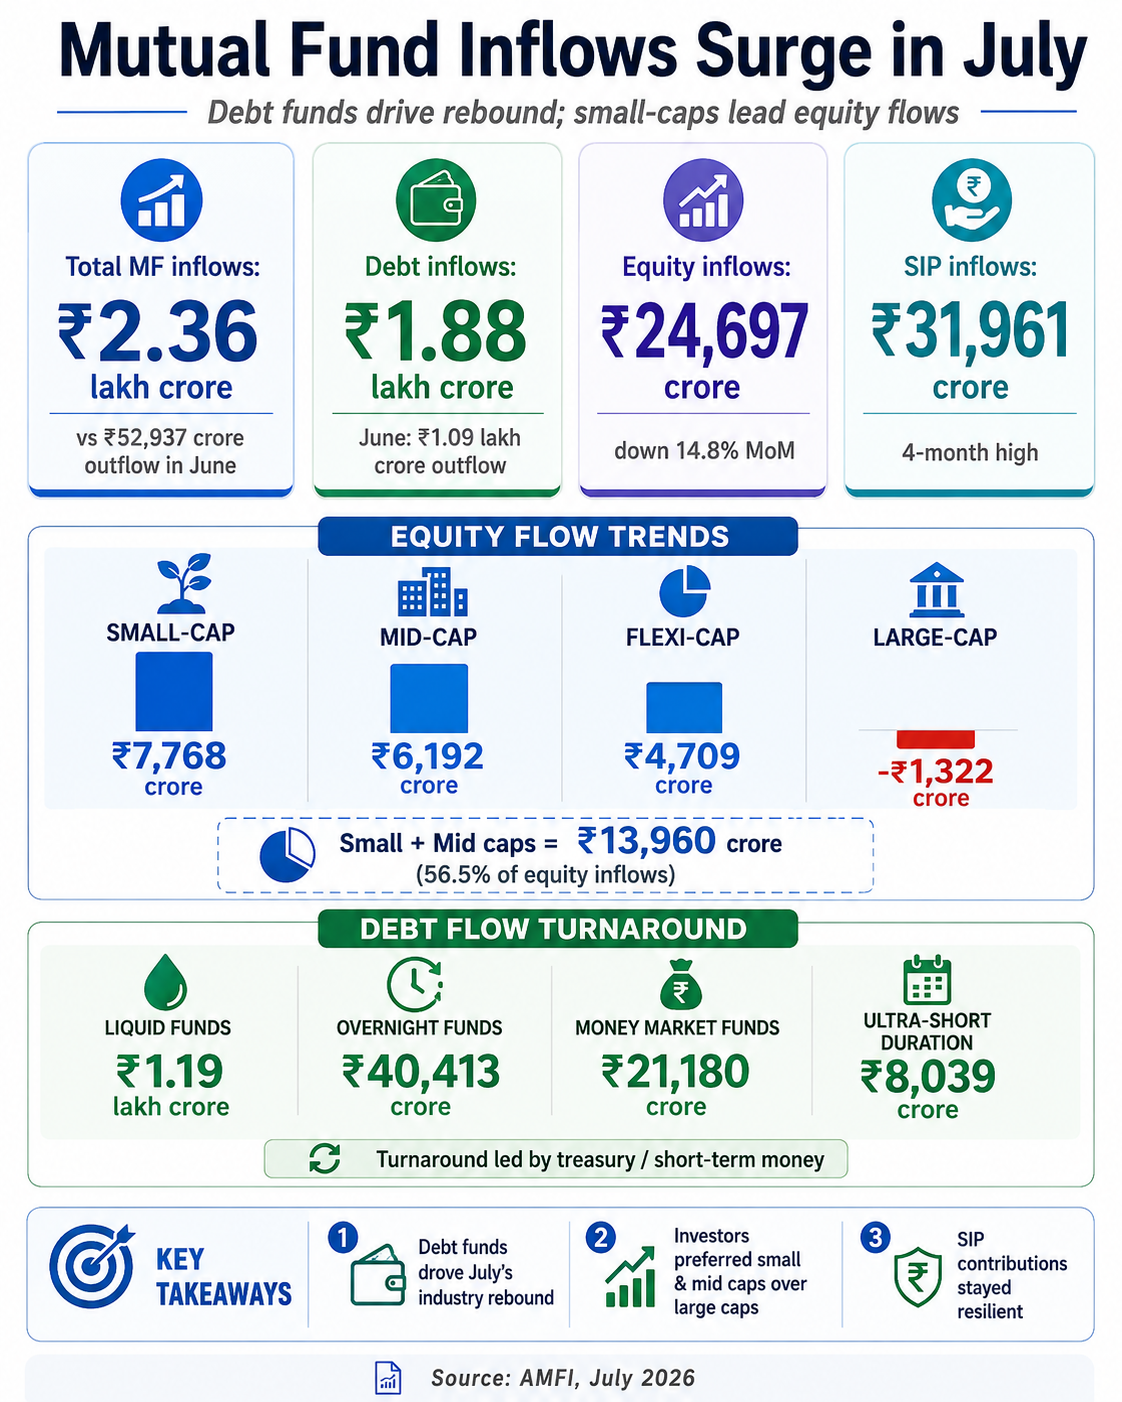
Mutual fund inflows surge sharply as debt funds drive the turnaround
According to the latest AMFI data, mutual funds recorded net inflows of Rs 2.36 lakh crore in July, compared with net outflows of Rs 52,937 crore in June.
Debt mutual funds were responsible for most of that improvement. Debt schemes attracted Rs 1.88 lakh crore in July after investors withdrew Rs 1.09 lakh crore in June.
That represents a swing of nearly Rs 3 lakh crore in just one month.
The reversal, however, was concentrated largely in short-term and liquidity-oriented debt categories rather than long-duration funds.
Key figures verified
- Total mutual-fund inflows: ₹2.36 lakh crore in July, versus ₹52,937 crore outflow in June.
- Equity MF inflows: ₹24,697 crore, down 14.8% MoM from ₹28,973 crore.
- Small-cap inflows: ₹7,768 crore.
- Mid-cap inflows: ₹6,192 crore.
- Large-cap funds: ₹1,322 crore outflow — the first monthly outflow in 30 months, according to current reporting.
- SIP contributions: ₹31,961 crore in July versus ₹31,781 crore in June, up about 12% YoY.
Your source also says small- and mid-cap funds together attracted ₹13,960 crore, or roughly 56.5% of July equity inflows.
Monthly Flow of Mutual Funds (Rs cr)
| Category | July 2026 | June 2026 | May 2026 | Apr-25 |
|---|---|---|---|---|
| Equity | 24,697.39 | 28,973.41 | 22,907.77 | 38,440.2 |
| Debt | 187,511.32 | -1,09,053.65 | -96,948.51 | 247,490.03 |
| Hybrid | 11,490.56 | 12,892.76 | 10,560.24 | 20,565.24 |
| Other schemes | 12,517.00 | 16,724.26 | 361.99 | 20,082 |
| Solution-oriented schemes | 378.77 | 320.87 | 270.36 | 306.98 |
| Closed-ended and interval schemes | -680.72 | -2,794.39 | -1,155.53 | -4,467.31 |
| Total | 235,914.32 | 56,116.91 | -64,003.68 | 322,417.14 |
Source: AMFI Source: Moneycontrol
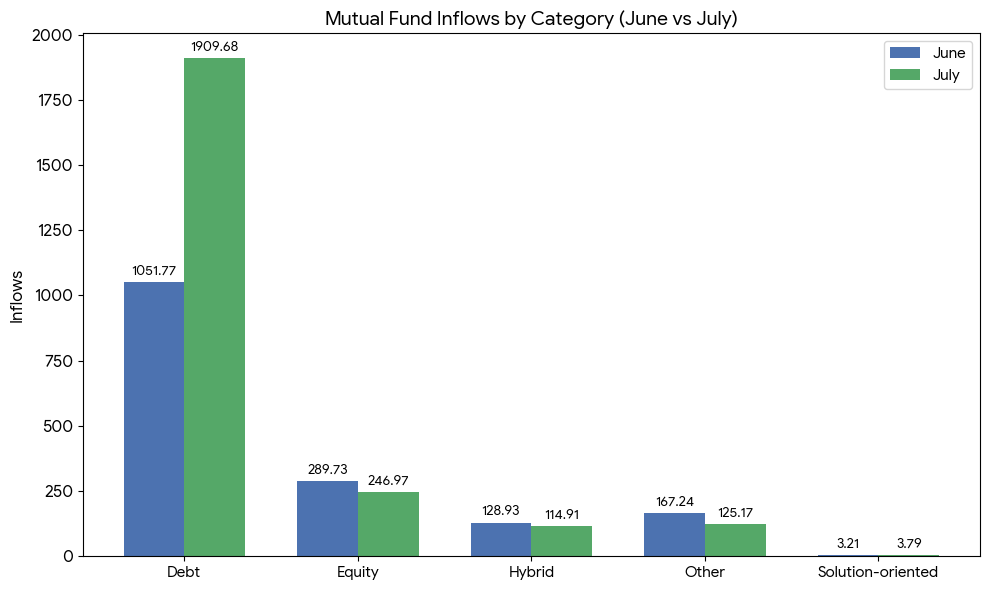
Equity mutual fund inflows fall 15% but remain firmly positive
Equity mutual fund inflows moderated to Rs 24,697 crore in July from Rs 28,973 crore in June, a decline of 14.8%.
Despite the fall, equity schemes continued to attract fresh money for another month.
The July decline also follows a strong June, when equity mutual fund inflows had risen 26.5% from Rs 22,908 crore in May.
Equity assets under management continued to expand, increasing about 3% to Rs 38.36 lakh crore in July from Rs 37.34 lakh crore in June.
Small-cap and mid-cap funds emerge as the biggest equity winners
The most important trend inside the equity mutual fund category was the continued preference for smaller companies.
Small-cap funds attracted Rs 7,768 crore in July, up 39% from Rs 5,602 crore in June. Mid-cap funds received Rs 6,192 crore, slightly higher than Rs 6,090 crore in June.
Together, mid-cap and small-cap funds attracted Rs 13,960 crore.
That accounted for nearly 56.5% of total equity mutual fund inflows during July, compared with around 40% in June.
“The bigger story is that money is following performance,” said Santosh Joseph, CEO, Germinate Investor Services.
He noted that mid- and small-cap stocks had led the market recovery since March, while large caps had lagged.
Flexi-cap funds remained another major destination for investors, although inflows declined around 10% to Rs 4,709 crore.
Read More : CAS Changes Option Trading Game: Why Prop Desks Are Cutting Positions After 0DTE Risk Rises
Monthly Flow of Equity Oriented Schemes (Rs cr)
| Category | July 2026 | June 2026 | May 2026 | Apr-25 |
|---|---|---|---|---|
| Multi-cap funds | 3,227.29 | 3,070.26 | 2,291.01 | 3,806.01 |
| Large-cap funds | -1,321.69 | 2,067.48 | 1,592.93 | 2,524.61 |
| Large- and mid-cap funds | 3,425.34 | 4,321.32 | 3,278.22 | 4,490.49 |
| Mid-cap funds | 6,192.31 | 6,090.17 | 4,385.06 | 6,551.40 |
| Small-cap funds | 7,767.50 | 5,601.96 | 4,945.57 | 6,885.90 |
| Dividend yield funds | -169.16 | -49.44 | -97.46 | -20.58 |
| Value funds/contra funds | -144.61 | 686.79 | 509.57 | 1,478.08 |
| Focused funds | 642.18 | 1,118.18 | 830.25 | 1,194.80 |
| Sectoral/thematic funds | 1,328.27 | 1,469.26 | 647.87 | 1,949.36 |
| ELSS funds | -959.13 | -633.88 | -650.78 | -567.73 |
| Flexi-cap funds | 4,709.08 | 5,231.31 | 5,175.54 | 10,147.85 |
| Total | 24,697.39 | 28,973.41 | 22,907.78 | 38,440.20 |
Source: AMFI Source: Moneycontrol
Large-cap funds lose investor favour as market preferences change
The contrast was particularly visible in large-cap funds.
After attracting Rs 2,067 crore in June, large-cap funds recorded a net outflow of Rs 1,322 crore in July.
Large- and mid-cap funds also saw inflows decline 21% to Rs 3,425 crore, while multi-cap funds recorded a modest 5% increase to Rs 3,227 crore.
Value and contra funds moved into negative territory with Rs 145 crore of outflows, compared with Rs 687 crore of inflows in June.
ELSS funds also remained under pressure, with outflows widening to Rs 959 crore from Rs 634 crore.
Monthly flow trend of income-/debt-oriented schemes (Rs crore)
| Category | July 2026 | June 2026 | May 2026 | Apr-25 |
|---|---|---|---|---|
| Overnight funds | 40,412.55 | -10,579.58 | -15,524.77 | 31,420.45 |
| Liquid funds | 119,065.85 | -42,293.29 | -29,680.94 | 165,104.67 |
| Ultra-short-duration funds | 8,039.08 | -11,426.26 | -1,617.01 | 15,651.87 |
| Low-duration funds | 987.88 | -16,484.01 | -9,400.49 | 7,093.26 |
| Money market funds | 21,180.23 | -10,595.39 | -24,691.74 | 20,642.59 |
| Short-duration funds | 840.23 | -5,887.18 | -3,887.05 | 3,917.21 |
| Medium-duration funds | -4.96 | -243.27 | -263.30 | -392.22 |
| Medium- to long-duration funds | -54.46 | -766.36 | -229.03 | -157.72 |
| Long-duration funds | -618.25 | -719.75 | -896.71 | -727.19 |
| Dynamic bond funds | -581.63 | -961.46 | -653.69 | -704.60 |
| Corporate bond funds | -784.70 | -7,557.33 | -7,009.94 | 6,196.51 |
| Credit risk funds | 145.07 | 247.55 | 49.46 | 1,317.68 |
| Banking and PSU funds | -452.48 | -1,041.43 | -760.34 | -693.89 |
| Gilt funds | -205.80 | -1,095.55 | -1,683.60 | -1,048.49 |
| Gilt funds with 10-year constant duration | -62.27 | -102.48 | -298.76 | -149.27 |
| Floater funds | -395.02 | 452.14 | -400.62 | 19.17 |
| Total | 187,511.32 | -1,09,053.65 | -96,948.53 | 247,490.03 |
Source: AMFI Source: Moneycontrol
Debt mutual funds see a massive reversal led by liquid schemes
Debt mutual funds were the biggest story in the July AMFI data.
Liquid funds alone attracted Rs 1.19 lakh crore, reversing an outflow of Rs 42,293 crore in June.
Overnight funds also swung sharply, moving from a Rs 10,580 crore outflow to a Rs 40,413 crore inflow.
Money market funds attracted Rs 21,180 crore, while ultra-short-duration funds moved back into positive territory with Rs 8,039 crore of inflows.
“The turnaround was driven primarily by large allocations into liquidity-oriented categories,” said Nehal Meshram, Senior Analyst, Morningstar Investment Research India.
According to Meshram, the numbers suggest the return of corporate treasury and institutional surplus money rather than a broad shift toward longer-duration debt strategies.
Debt AUM consequently climbed 11% to Rs 19.33 lakh crore in July.
Why investors remained cautious on longer-duration debt
The recovery was not broad-based across debt mutual funds.
Corporate bond funds still recorded outflows of Rs 785 crore, although that was significantly lower than the Rs 7,557 crore outflow in June.
Long-duration, dynamic bond, banking and PSU, and gilt funds also remained under pressure.
Varun Gupta, CEO of Groww Mutual Fund, said, “The sharp reversal in debt flows was the most notable feature of the month,” highlighting strong flows into liquid, overnight and money market funds.
SIP inflows provide a stronger signal for long-term investors
While monthly equity inflows moderated, SIP inflows continued to show resilience.
SIP contributions reached Rs 31,961 crore in July, compared with Rs 31,781 crore in June. Contributions were also 12.3% higher than a year earlier.
The SIP stoppage ratio improved to 81.9% from around 91% in June.
Around 61.44 lakh new SIPs were registered in July, compared with 50.29 lakh SIPs that matured or were discontinued.
“SIP inflows reached a four month high of ₹31,961 crore in July,” said Feroze Azeez, Joint CEO, Anand Rathi Wealth.
For long-term investors, this remains an encouraging signal because fresh SIP registrations continued to outpace stoppages.
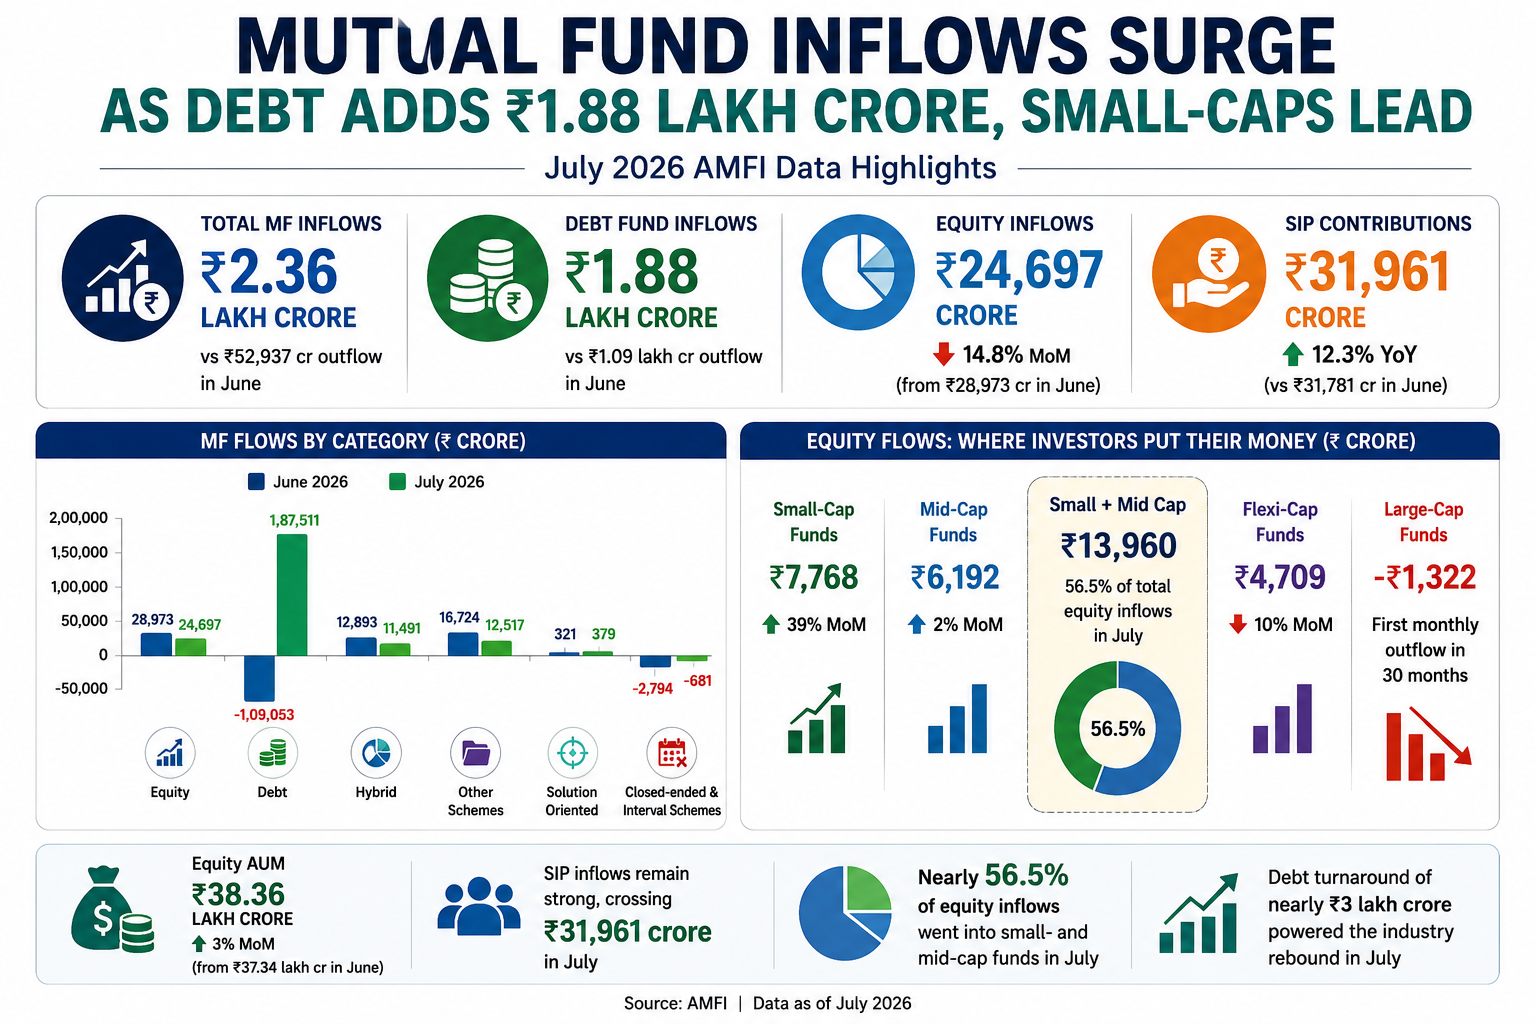
Here’s what happened today and why investors reacted
The July AMFI mutual fund data shows that India’s investment flows remain strong, but investor preferences are changing.
The Rs 2.36 lakh crore industry-wide inflow looks impressive, but most of the improvement came from the sharp reversal in debt mutual funds.
Equity investors, meanwhile, continued to favour small-cap, mid-cap and flexi-cap funds, while large-cap funds struggled to attract fresh money.
For investors, this creates two important signals. First, domestic savings remain a powerful source of market liquidity. Second, strong flows into small and mid-cap funds also mean valuations and portfolio concentration need to be watched carefully.
Gold ETFs remained positive but saw inflows fall 55% to Rs 1,559 crore from Rs 3,443 crore in June.
Hybrid fund inflows also moderated 11% to Rs 11,491 crore, although arbitrage funds attracted Rs 6,502 crore.
The key takeaway from the July mutual fund inflows data is therefore not simply that money returned to mutual funds. It is that investors are becoming increasingly selective about where that money goes.
For the coming months, investors will be watching whether small- and mid-cap flows remain strong, whether large-cap funds regain traction and whether debt inflows continue after the quarter-end treasury effect fades.