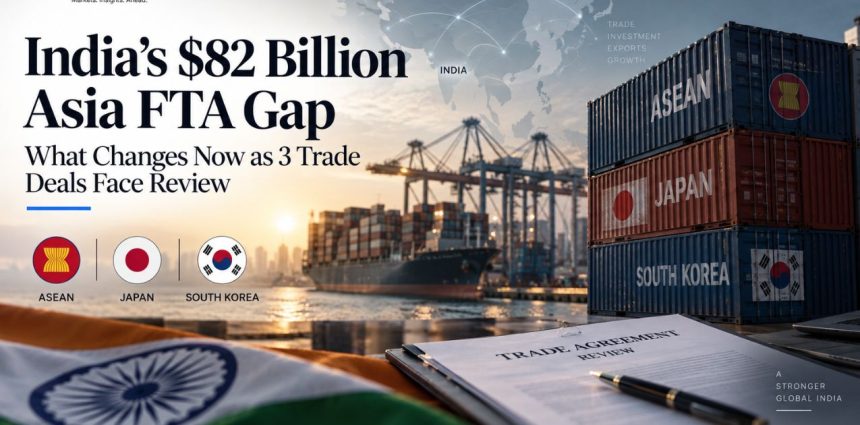
India’s merchandise trade deficit with three long-standing Asian trade agreements — ASEAN, Japan and South Korea — approached $82 billion in FY2025-26, even as all three pacts moved into review or upgrade processes.
The gap does not, by itself, prove that the agreements failed. India imports energy, machinery, components and other industrial inputs from these markets. But the numbers expose a persistent expectation gap: India negotiated preferential market access for its exporters, yet imports have expanded much faster than exports in these three relationships.
The question now is less about whether India should have signed the agreements and more about how much of the access already negotiated Indian businesses are actually capturing.
ALSO READ: India FTA $1 Trillion Export Target by 2030: Stocks to Watch
The $82-billion gap
The latest trade data show how sharply the imbalance has widened.
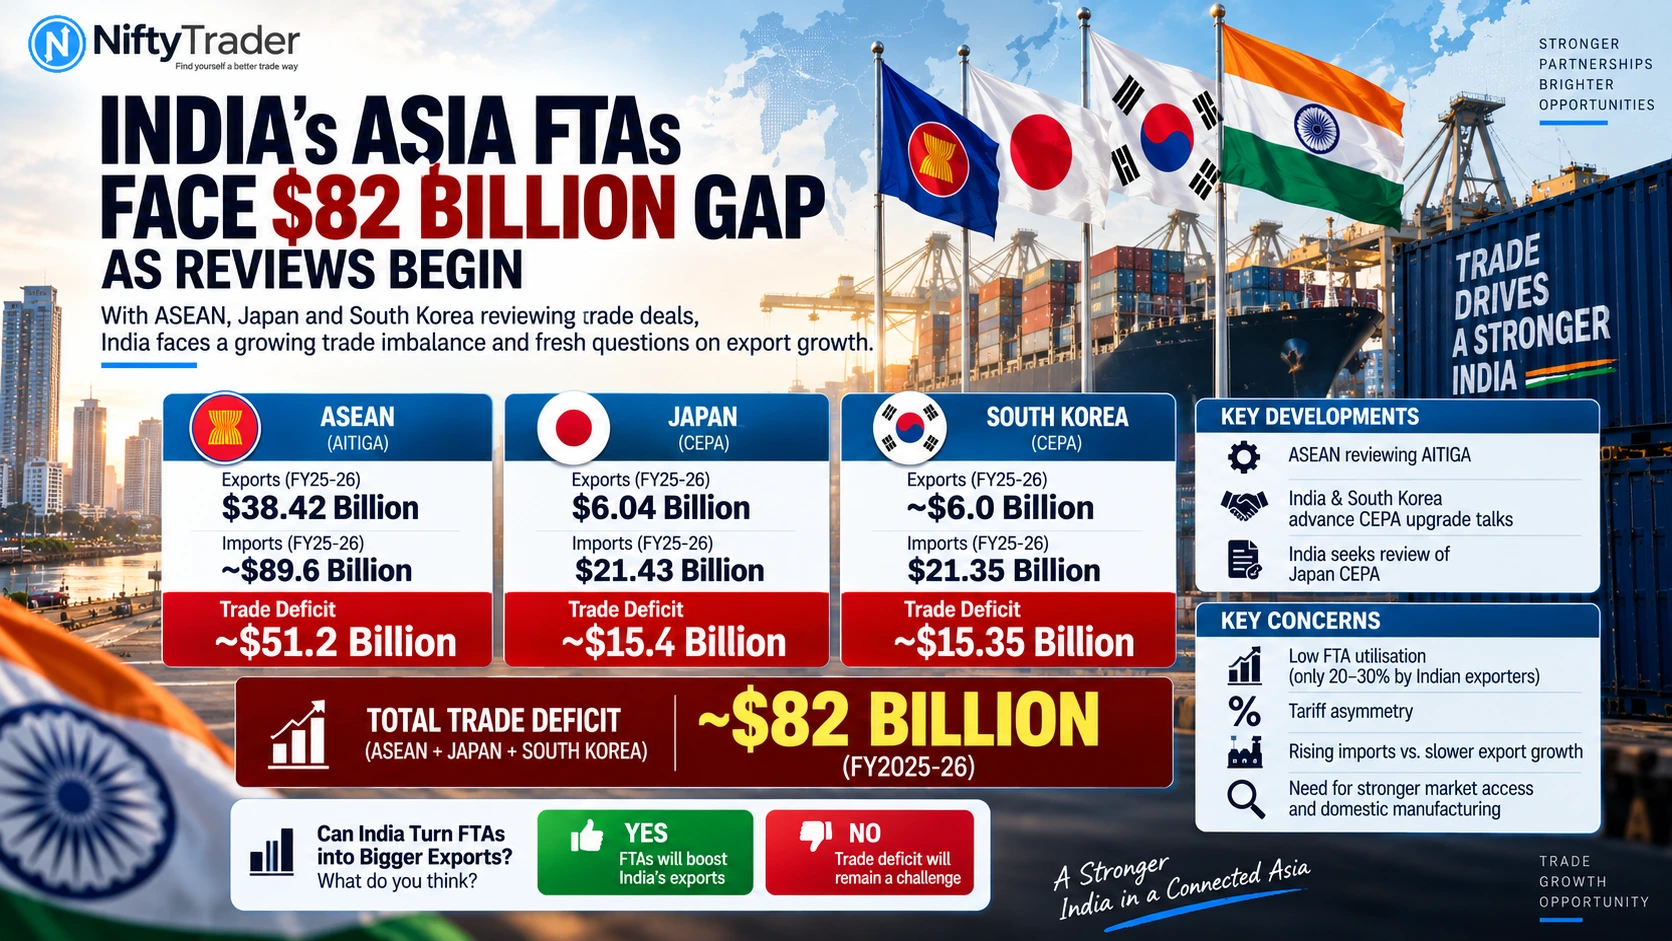
India exported $38.42 billion of merchandise to ASEAN in FY2025-26. With total India-ASEAN trade at about $128 billion, imports work out to roughly $89.6 billion, implying a deficit of around $51.2 billion. The government says ASEAN accounted for about 11% of India’s global trade in FY2025-26.
With Japan, India exported $6.04 billion of goods and imported $21.43 billion, leaving a deficit of about $15.4 billion. Japan’s bilateral trade with India totalled $27.47 billion during the fiscal year, according to the Indian Embassy in Tokyo.
With South Korea, exports were around $6 billion and imports about $21.35 billion in FY2025-26, producing a deficit of roughly $15.35 billion. The two governments have also explicitly acknowledged the widening bilateral deficit during CEPA upgrade talks.
Taken together, the three merchandise deficits come to approximately $82 billion in one financial year.
| FY2025-26 | India’s exports | India’s imports | Approx. deficit |
|---|---|---|---|
| ASEAN | $38.42 bn | ~$89.6 bn | ~$51.2 bn |
| Japan | $6.04 bn | $21.43 bn | ~$15.4 bn |
| South Korea | ~$6.0 bn | $21.35 bn | ~$15.35 bn |
| Combined | ~$50.5 bn | ~$132.4 bn | ~$81.9 bn |
The ASEAN deficit is an approximation because the government’s $128-billion bilateral-trade figure is rounded, while the export figure is reported precisely at $38.416 billion.
The longer trend is harder to ignore
The June 2026 Global Trade Research Initiative (GTRI) report, FTA Report Card 2026: Six Challenges India Can No Longer Ignore puts the current gap into a longer historical context.
Using 2007-09, before these agreements took effect, as the benchmark and comparing it with 2023-25 averages, GTRI estimates that India’s trade deficit rose by:
381% with ASEAN, 318% with Japan and 268% with South Korea.
The deficit with the rest of the world increased by 142% over the same comparison period. GTRI estimates that India’s average annual trade deficit with ASEAN, Japan and South Korea reached about $62 billion over the latest three-year period in its study.
That comparison does not establish that FTAs alone caused the deterioration. GTRI itself cautions that its trade data cover total trade with FTA partners, rather than only transactions using preferential FTA tariffs.
Trade balances are also influenced by energy prices, commodity demand, exchange rates, domestic consumption and competitiveness.
But the persistence of the gap raises a narrower issue: the export response has not matched the scale of import growth in these relationships.
Why the imbalance keeps widening
GTRI points to tariff asymmetry as one important explanation.
The report estimates India’s trade-weighted MFN tariff at around 12.6%, while average MFN tariffs are close to zero in Singapore and below 4% in Japan, Australia, Malaysia and the UAE.
That produces very different economics when tariffs are cut under an FTA.
Consider a simple example. If a country cuts a 30% import tariff to zero, a foreign supplier gets a substantial reduction in its landed cost.
An Indian exporter entering a market where the ordinary tariff was already only 1-3%, however, may receive a much smaller incremental benefit from the same agreement.
GTRI’s trade-flow comparison reinforces the point. Imports facing MFN tariffs below 5% account for 100% of imports in Singapore, 91.9% in Japan, 86.4% in Malaysia, 73.9% in Vietnam and 66.5% in South Korea, compared with 28.3% in India.
The result is a structural asymmetry: India can give partner-country exporters a larger new price advantage in its domestic market than Indian exporters receive in markets that were already relatively open.
Indian exporters are not fully using the access
This may be the biggest weakness in the current FTA model.
GTRI estimates that only around 20-30% of India’s eligible exports use FTA preferences, compared with 60-70% utilisation by exporters selling into India.
The reason can be surprisingly practical.
An exporter seeking preferential treatment may have to comply with rules of origin, certification requirements, documentation and customs procedures. When the alternative MFN tariff is already zero or only a few percentage points, the saving may not justify those costs.
GTRI says only 4.6% of India’s imports enter duty-free under MFN treatment, while 68.7% continue to face normal customs duties. That makes preferential access into India potentially more valuable to foreign exporters than preferential access into many partner markets is to Indian exporters.
So the problem is not simply that India has market access.
It is that market access on paper is not the same thing as commercially useful market access.
The manufacturing risk sits underneath the trade gap
The FTA debate becomes more complicated when tariffs on imported inputs are considered alongside tariffs on finished goods.
GTRI highlights the problem of inverted duty structures, where raw materials or industrial inputs face higher duties than finished products.
The report cites 7.5-10% MFN duties on steel and aluminium, while machinery, industrial equipment and engineering products made using those materials can in some cases enter India duty-free under FTAs. GTRI identifies similar distortions in chemicals, plastics, rubber and textiles.
That can leave Indian manufacturers paying more for inputs while competing against finished imported products receiving preferential treatment.
The risk goes beyond a bigger import bill.
If producing a finished good abroad becomes structurally cheaper than making it in India, firms can have an incentive to locate production in an FTA partner country and ship the finished product back into India.
GTRI describes this possibility as “Make in ASEAN, Sell in India.”
That remains a forward-looking risk identified by GTRI, rather than evidence that Indian manufacturing is already moving wholesale to ASEAN.
All three agreements are now being reworked — but differently
This is what makes the issue particularly relevant in 2026.
ASEAN: AITIGA review is active
India hosted the 13th ASEAN-India Trade in Goods Agreement Joint Committee meeting from July 6-10, 2026.
The review is working through areas including customs and trade facilitation, national treatment and market access, and rules of origin. The joint committee also directed negotiators to accelerate the remaining chapters.
The government says India-ASEAN bilateral trade reached approximately $128 billion in FY2025-26.
South Korea: CEPA upgrade talks are underway
India and South Korea held the 12th round of CEPA upgrade negotiations in New Delhi from May 25-27, 2026.
The official Indian account says both sides acknowledged that India’s bilateral trade deficit had risen significantly since the CEPA came into force in 2010 and agreed to address the issue within the broader upgrade framework. Discussions covered goods, services, rules of origin, investment and SPS standards, with additional work planned on digital trade, supply chains and strategic industrial cooperation.
The Indian Embassy in Seoul says the two sides are seeking a modernised CEPA and that the latest round was the 12th upgrade round.
Japan: India has requested a CEPA review
The India-Japan CEPA came into force on August 1, 2011 and envisaged tariff abolition on more than 94% of traded items over 10 years.
India’s Commerce Ministry says India has requested Japan to review the CEPA.
The bilateral trade numbers explain why the issue is receiving attention: India imported $21.43 billion from Japan in FY2025-26 against exports of $6.04 billion.
The three agreements are therefore at different stages, but all three are now part of active review or upgrade processes.
The next test is Europe
India’s experience with its older Asian FTAs arrives just as a much larger trade experiment moves forward.
The EU and India concluded negotiations for their Free Trade Agreement on January 27, 2026. The European Commission says the EU was India’s third-largest trading partner in 2025, with goods trade worth €118 billion, or 11.1% of India’s total trade.
The lesson from ASEAN, Japan and Korea is that tariff cuts alone do not guarantee that exporters will capture the available opportunity.
European trade adds another layer of complexity.
The EU’s Carbon Border Adjustment Mechanism entered its definitive regime on January 1, 2026. It applies to selected goods in sectors including cement, iron and steel, aluminium, fertilisers, electricity and hydrogen and involves reporting, authorisation and carbon-certificate obligations for affected imports.
The European Commission has also continued issuing detailed implementation guidance during 2026.
GTRI argues that carbon-related requirements and other regulatory measures could reduce the commercial value of some tariff concessions Indian exporters obtain under the EU agreement. That is an analytical assessment, not a measured estimate of how much of the tariff benefit will ultimately be lost.
That creates the next expectation gap:
A trade agreement may remove tariffs, but compliance, carbon and standards costs can still determine whether an Indian product is competitive at the point of sale.
ALSO READ: EU-India FTA Moves Closer to Signing: 7 Indian Sectors in Focus
What needs to change in FTA 2.0
The policy challenge is increasingly shifting from signing FTAs to managing them.
India can improve outcomes by making rules of origin easier to comply with, reducing certification friction, pursuing mutual recognition of standards, addressing non-tariff barriers and correcting inverted duties that raise manufacturing costs.
The government itself says it is now focusing on the effective utilisation of FTAs, with the objective of translating market access into wider export participation, investment and employment.
GTRI has proposed more systematic monitoring of FTA utilisation, import surges and sector-level outcomes. It also recommends reducing duties on industrial inputs and strengthening domestic manufacturing and supply chains.
| What policymakers can track | Why it matters |
|---|---|
| FTA preference utilisation | Shows whether exporters actually use the agreement |
| India’s share of partner-country imports | Measures real market penetration |
| New exporters and MSME participation | Shows whether benefits are spreading |
| Domestic value addition | Tests whether manufacturing gains stay in India |
| Sectoral import surges | Identifies vulnerable industries |
| Rules-of-origin compliance | Shows whether paperwork is blocking utilisation |
The objective is not necessarily to reduce imports.
Imported machinery, components and energy can support domestic production. The more meaningful test is whether those imports help Indian firms become more competitive exporters rather than leaving India with a permanently import-heavy trade structure.
India’s export story is bigger than these three deficits
There is an important counterweight to the $82-billion headline.
India’s exports are not broadly collapsing. Government data show combined goods and services exports reached a record $863.1 billion in FY2025-26, comprising $441.8 billion of merchandise exports and $421.3 billion of services exports.
That makes the FTA issue more specific.
India has demonstrated that it can expand its overall export base. The unresolved question is whether it can turn preferential trade agreements into stronger merchandise-export growth in the same markets where imports have expanded sharply.
That is a more precise challenge than simply saying India’s export strategy is struggling.
Check Live to explore: NiftyTrader: Live Options Analytics & F&O Trading Tools
What to watch next
The immediate test is whether the ASEAN review, Korea CEPA upgrade and Japan CEPA review produce changes that Indian companies can actually use.
For ASEAN, rules of origin and market access remain central to the AITIGA review. For Korea, negotiations are expanding into services, digital trade, supply chains and strategic industrial cooperation. For Japan, New Delhi has formally requested a CEPA review.
The uncertainty is how quickly these changes can alter the underlying economics.
Even a better FTA cannot indefinitely compensate for expensive industrial inputs, logistics costs, financing costs, certification expenses or other domestic competitiveness constraints.
That leaves India facing a consequential test:
Can the next phase of FTAs generate more Indian exports, investment and domestic value addition — or will trade continue growing with the import side pulling further ahead?
The $82-billion gap does not answer that question.
But it makes the question much harder to ignore.
Read Next: SEMICON India 2026: Applied Materials Unveils $5 Billion India Chip Plan
Disclaimer
This article is for informational and educational purposes only and should not be construed as financial, investment or trading advice. NiftyTrader does not provide investment advice, buy/sell recommendations or guaranteed trading strategies. Readers should conduct independent research and consult a SEBI-registered financial adviser before making financial decisions.