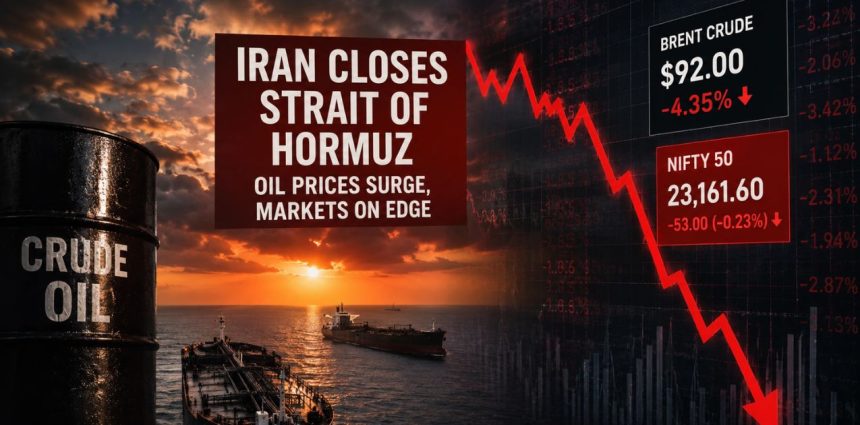
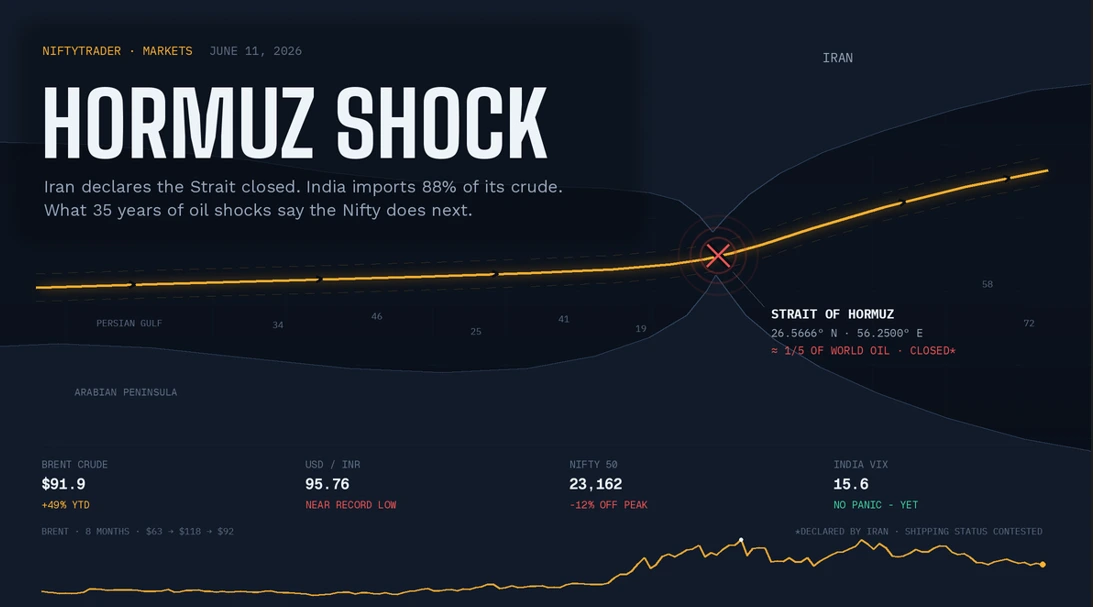
Mumbai | June 11, 2026 — Iran declared the Strait of Hormuz closed “until further notice” on Wednesday night after a fresh wave of American strikes, claiming hits on two commercial vessels and on US bases in Bahrain, Kuwait, and Jordan. Washington disputes that Tehran controls the waterway at all. Brent crude spiked to $96.4 a barrel before fading to about $92, and the Nifty 50, after sliding nearly 100 points intraday, closed Thursday just 53 points lower at 23,161.60.
That gap, between the scariest energy headline since 2022 and a market that fell barely a quarter of a percent, is the real story. Here is what is actually happening, what India pays for it, and what every comparable oil shock since 1990 did to Indian equities next.
What happened overnight, and why oil isn’t at $130
The sequence since Monday has been brutal and fast. Monday’s session erased roughly ₹5 lakh crore of investor wealth as the Sensex plunged 719 points. Tuesday brought a 395-point relief bounce after Israel and Iran paused direct attacks. Then late Wednesday, US strikes on what CENTCOM called “multiple targets” inside Iran triggered Tehran’s most dramatic step of this four-month conflict: a declaration that the Strait of Hormuz is closed to all commercial shipping, enforced, Iran claims, by strikes on two vessels.
Yet look at the tape, not the headlines. Brent’s front-month contract touched $96.36 in Asian hours on Thursday and then gave most of it back, settling near $92. A genuine, enforced closure of a waterway carrying ~20 million barrels a day would not produce a 4% intraday round trip; analysts at Rystad have warned a sustained shut-off points toward $150–180 crude. The oil market is telling you it believes the declaration is, for now, more weapon of words than of mines: Iran’s own exports, its last reliable revenue, leave through the same strait, US naval escorts are operating, and insurers, while repricing war-risk premiums sharply, have not abandoned the route.
India’s equity market drew the same conclusion. The Nifty’s day was a microcosm: it was down to 23,072 in the morning, back above 23,300 by noon, and closed at 23,161.60 (−0.23%). The Sensex finished at 73,832.55. India VIX, the fear gauge, sits at just 15.6, elevated nowhere near the 28+ panic prints of March.
Hormuz is India’s jugular—the numbers
If the declaration does harden into enforcement, no large economy is more exposed than India.
India imports about 88% of the crude oil it consumes, roughly 4.8–5 million barrels every day. After US sanctions forced Indian refiners to wind down Russian purchases through late 2025, the supply mix has swung back hard toward the Gulf: Iraq, Saudi Arabia, the UAE, and Kuwait; every one of those barrels transits Hormuz. So does the majority of India’s LNG, anchored by long-term Qatari contracts. Call it half of India’s oil and most of its imported gas through a corridor 33 km wide at its narrowest.
The buffer is thin. India’s strategic petroleum reserves hold roughly 9–10 days of net imports; adding refinery and in-transit stocks stretches total cover toward 70 days. That is vastly better than 1990, when reserves covered barely a fortnight and the oil shock helped tip India into a full balance-of-payments crisis, but it is not immunity. It is a clock.
The number that matters: crude at ₹8,800 a barrel
Dalal Street’s mistake in every oil scare is watching the dollar price alone. India pays in rupees, and the rupee is at 95.76 to the dollar, within touching distance of its record low near 97, a depreciation of more than 11% in a year that has quietly amplified every move in Brent.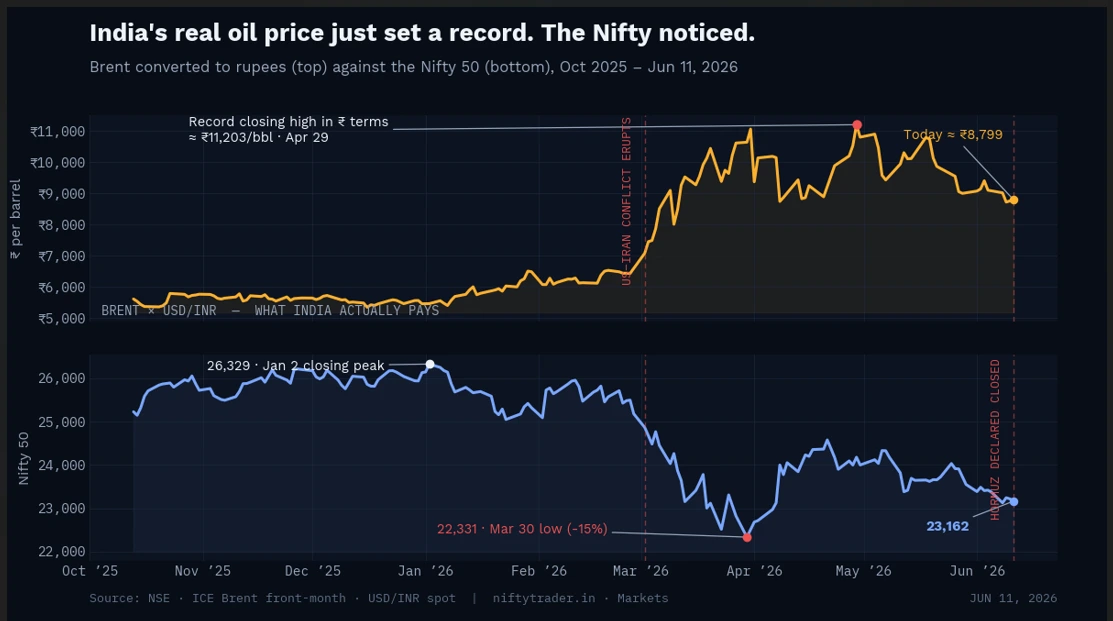
Multiply the two and you get India’s true oil price: about ₹8,800 a barrel today. At the April 29 peak, Brent closed at $118 and hit $126 intraday; the figure hit ≈ ₹11,200 on a closing basis, decisively above the ~₹9,700–10,600 extreme of the 2022 Russia-Ukraine shock. By the only measure that hits India’s trade deficit, fuel pumps and corporate margins, this spring’s oil was the most expensive in the country’s history, and the Nifty’s 16% peak-to-trough slide tracked it almost beat for beat.
The macro arithmetic compounds quickly. Economists’ standard rule of thumb: every sustained $10/barrel increase widens India’s current account deficit by 0.3–0.4% of GDP (about $12–15 billion), adds 30–35 basis points to CPI inflation, and shaves a similar amount off growth. The RBI saw this coming: on June 5 it held the repo rate at 5.25%, kept a neutral stance, and cut its FY27 growth forecast from 6.9% to 6.6%, flagging crude as the swing risk. New Delhi, meanwhile, has reached for the 2022 playbook, a revised windfall levy on fuel exports from June 1, a ₹3/litre export tax on petrol, excise relief on E22–E30 ethanol blends, and an RBI dollar-swap window to steady the rupee.
The oil shock playbook: every episode since 1990
This is the sixth time in 35 years that a Gulf or oil crisis has slammed Indian equities. The record is remarkably consistent, with one exception that proves the rule.
| Episode | Oil move | Indian equities | Time to recover |
|---|---|---|---|
| Aug 1990 — Iraq invades Kuwait | ~$18 → $40+ | Sensex fell over 30% in the following months; BoP crisis, gold pledged | Years — only after 1991 reforms |
| Mar 2003 — US invades Iraq | Spike, then collapse | War’s start was the bottom (~3,000 Sensex) | Immediate; +70% within a year |
| Sep 2019 — Abqaiq drone attack | Brent +15% in a day, biggest since 1991 | Sensex −~2% over two sessions | About two weeks |
| Feb–Mar 2022 — Russia invades Ukraine | Brent $139 intraday | Nifty −15% from peak to 15,671 (Mar 8) | All regained by early April (+15% in 4 weeks) |
| Jun 2025 — Israel–Iran 12-day war | Brent ~$64 → $81; Iran’s parliament voted to close Hormuz, never did | Nifty dipped under 3% | Within days of the Jun 24 ceasefire |
| Mar 2026–now — US–Iran conflict | Brent $61 → $126 → $92 | Nifty −15.9% peak to trough; −12% currently | Open |
The pattern is not subtle. Equity damage tracks barrels actually lost, not decibels of headlines. In 2019 and 2025, supply fears evaporated within days, and so did the drawdowns. In 2022, Russian oil was rerouted rather than removed, and the Nifty round-tripped in a month. The catastrophe of 1990 needed two ingredients: a genuine, sustained loss of supply and a country with no reserves, no flexibility, and three weeks of foreign exchange. India in 2026 carries forex reserves covering roughly ten months of imports, a diversified (if newly Gulf-heavy) supplier slate, and strategic stockpiles. The vulnerability is real; the fragility of 1990 is not.
Notice, too, what last June taught the market: Iran threatening Hormuz is a tradable bluff. Iran enforcing Hormuz has never actually been tested, which is exactly why Thursday’s declaration deserves respect rather than panic.
Two scenarios for the Nifty from here
Scenario 1 — declaration without enforcement (the 2019/2025 template). Tanker transits continue, perhaps thinner and pricier; war-risk insurance does the rationing; backchannel diplomacy resumes within one to three weeks. Brent bleeds back into the low-$80s, the rupee stabilises below 96, and the Nifty, already 12% cheap to its January peak, grinds toward the 23,500–23,860 resistance band, with the 24,090 May high as the bigger test. Every prior episode of this type resolved this way.
Scenario 2 — enforced closure (the untested template). Confirmed strikes on multiple tankers, mining of the shipping lanes, or a mass insurer withdrawal would mark the regime change. Brent gaps above $120–130 with Rystad-style $150+ scenarios live; crude in rupees takes out April’s ₹11,200 record; the rupee presses past 97 despite RBI swaps. For the Nifty, the March lows become the magnet: 22,450, then the 22,183 panic low, roughly 4% below Thursday’s close, with downside beyond that if the disruption runs past India’s reserve clock. This is the 1990-shaped tail risk: low probability, high consequence.
The tell between the two isn’t on a stock screen. Watch daily tanker transit counts through Hormuz, Lloyd’s war-risk premium quotes, and whether Brent can hold above $95 for more than 48 hours. The oil market will confirm enforcement before any government does.
Sector check: the obvious trades have stopped working
Here is the uncomfortable nuance for anyone reaching for the standard oil-shock playbook: the market has already front-run it, and the government has already taxed it.
| Theme | Stocks / segment | What’s happening |
|---|---|---|
| Upstream “winners”… taxed | ONGC ₹252.6, Oil India ₹429.4 | Both down ~15% in a month despite $90+ crude, the revised windfall levy caps realisations. Morgan Stanley now prefers ONGC over a downgraded Oil India. |
| OMCs squeezed | IOC ₹134, BPCL ₹286, HPCL ₹366 | Frozen pump prices + ₹8,800 crude = marketing-margin pain. IOC is down ~16% in three months and sits near its 52-week low. |
| Aviation & paints | IndiGo ₹4,502; Asian Paints ₹2,691 | Fuel is ~40% of airline costs; crude derivatives feed paint inputs. Both have rallied off deeply beaten-down bases, the damage was priced in early. Fresh oil spikes reopen the wound. |
| The hedge that isn’t | Nifty IT at 27,821 | The classic weak-rupee winner is 31% below its 52-week high (TCS −40%) because US demand and AI disruption fears outweigh currency gains. Don’t count on the old reflex. |
| The crowded trade | Nifty Energy at 38,656 | Up ~79% from its 52-week low and within 1% of its high. The war premium is in the price. |
| Relative shelter | Pharma, select FMCG, domestic financials | Dollar revenues or domestic demand limited crude linkage, though sticky fuel inflation that delays RBI rate cuts is the banks’ hidden risk. |
Levels and signals to watch
- Nifty 50: supports at 23,070 (this week’s low), then 22,900, then the March band of 22,450–22,183. Resistance at 23,330 (Thursday’s high), 23,500, then 23,860–24,090. A daily close above 23,500 would be the first sign the shock is being absorbed.
- Bank Nifty: held 54,750 on Thursday and closed at 55,177; 55,600 is the immediate ceiling.
- India VIX at 15.6: remarkably calm — which cuts both ways. Hedging via options is historically cheap; a decisive move through 20 would say institutions have stopped giving diplomacy the benefit of the doubt.
- Brent in rupees: above ₹10,000/bbl sustained = macro trouble; back under ₹7,500 = all-clear.
Track live option-chain positioning and daily FII/DII flows on NiftyTrader’s data pages, foreign investors’ cash-market behaviour over the next three sessions will reveal whether this is distribution or absorption.
What should investors actually do?
No one, not Tehran, not Washington, not your favourite analyst, knows which scenario prints. What history does support is a set of principles:
- Don’t sell a 12% correction into a headline. Across 2019, 2022 and 2025, panic-selling the spike was the single worst-timed decision available. The time to de-risk was January’s euphoria, not now.
- Let SIPs run. Systematic purchases through the March lows are already the best-performing rupees most retail portfolios deployed this year—equity mutual fund inflows held up through May for exactly this reason.
- Demand a discount for leverage. Futures-and-options positions in OMCs, aviation, and paints carry binary, headline-driven gap risk until tanker traffic data clarifies. Size accordingly or stand aside.
- Be suspicious of the obvious hedge. Energy is crowded, upstream is taxed, and IT is broken. If you must hedge, cheap index puts at a 15.6 VIX are the cleaner instrument than thematic stock-picking after the move.
- Pre-decide your Scenario-2 plan. Write down now what you’ll do if Brent holds above $110 for a week, because deciding during the gap-down is how 1990-style drawdowns claim their victims.
This is general market education, not personalised investment advice, position sizes and risk tolerance differ, so consult a SEBI-registered investment adviser before acting.
The bottom line
Iran has made a threat it has never before converted into action against a market that has spent four months pricing exactly this risk and a country incomparably better-buffered than in 1990. The Nifty at 23,162 is neither cheap enough to scream opportunity nor stretched enough to demand exit, it is a market waiting for one data series: ships moving through a 33-kilometre strait. Watch the barrels, not the bluster. Every oil shock of the modern era says the recovery, when supply survives, is faster than anyone positioned for fear can chase it.
FAQs
Is the Strait of Hormuz actually closed right now?
Iran has declared it closed “until further notice” and claims strikes on two vessels; the US says Iran does not control the strait, and commercial traffic is reported as disrupted but moving. Brent settling near $92, not $130+, is the market’s verdict that enforcement remains unproven.
How much of India’s oil comes through the Strait of Hormuz?
India imports about 88% of its crude, and with Russian supplies curtailed by sanctions since late 2025, roughly half of those imports, Iraqi, Saudi, Emirati, and Kuwaiti barrels, plus the majority of LNG transit through Hormuz.
Why did the Nifty fall only 0.23% on such a big headline?
Three reasons: the index has already corrected 12% since January; Brent’s intraday fade signalled trader scepticism about real enforcement; and India VIX at 15.6 shows institutions are still pricing a diplomatic off-ramp.
Which Indian stocks benefit from rising crude oil prices?
Traditionally, upstream producers like ONGC and Oil India, but the June 1 windfall-levy revision caps their gains, and both are down about 15% in a month. The Nifty Energy index near its 52-week high suggests the “war trade” is already crowded.
Will petrol and diesel prices rise in India now?
Pump prices have stayed administratively frozen, with OMCs absorbing the margin hit and the government adjusting excise (including relief on E22–E30 blends). A sustained move above ~₹10,000/bbl in rupee terms would intensify pressure for retail hikes after the current political calendar clears.
What happens to the Nifty if oil hits $130?
At ~96/dollar, that’s ₹12,500/bbl crude, beyond April’s record. The playbook points to a retest of the March lows at 22,450–22,183 first (about 4% down), with deeper risk only if disruption outlasts India’s ~70 days of total oil stock cover.