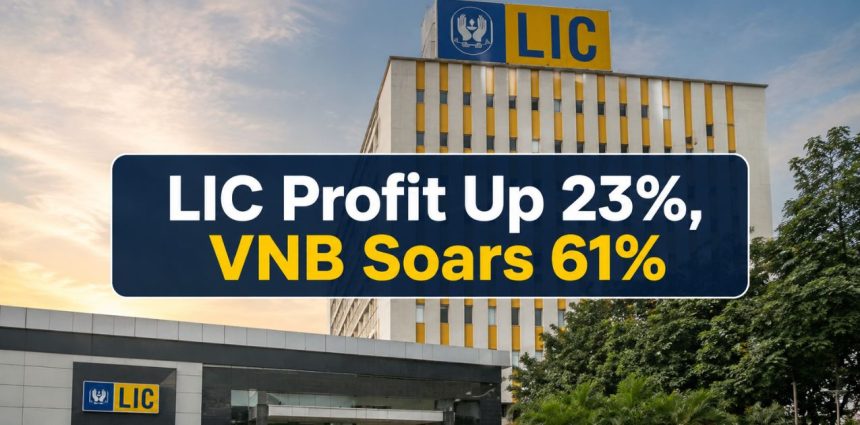
Why this matters today: LIC’s Q1 FY27 earnings landed on the same day the stock is already in focus for a different reason, the government just wrapped up a Rs 31,552-crore share sale that pushes LIC’s public shareholding to the SEBI-mandated 10% level. Two big stories, one counter, and they need to be read separately.
Check Live: LIFE INSURANCE CORPORATION OF INDIA
Profit and Premium Income: The Headline Numbers
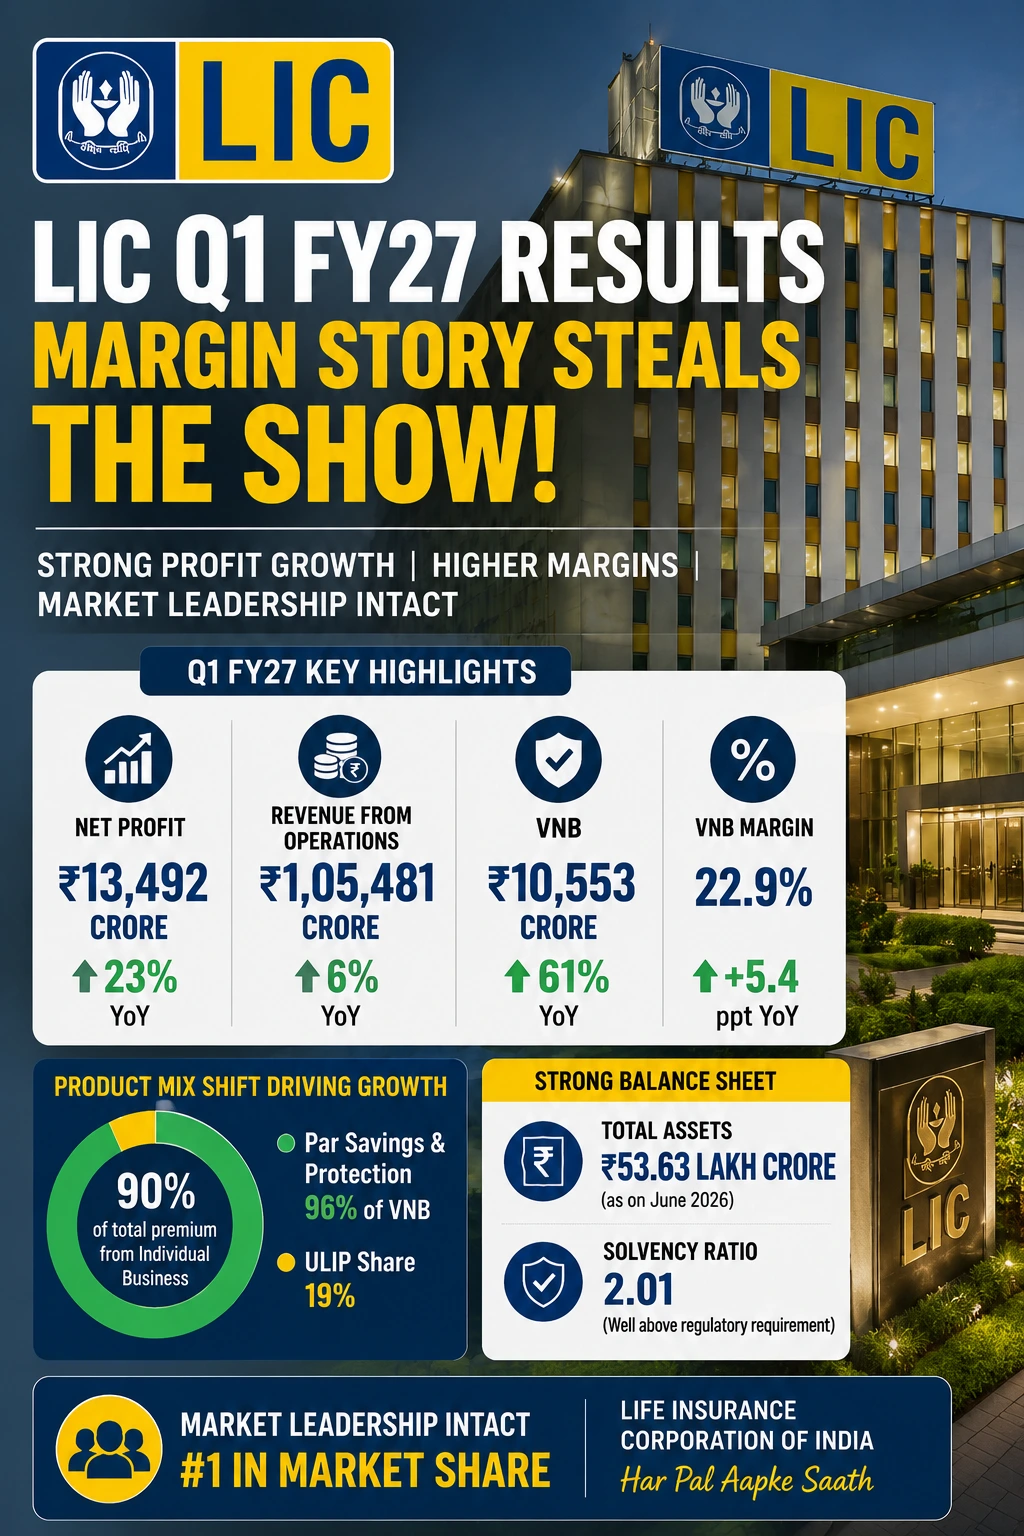
India’s largest life insurer reported a standalone net profit of Rs 13,492 crore for the June quarter, a 23% jump from Rs 10,986 crore in the same period last year. Net premium income rose 7% YoY to roughly Rs 1.27 lakh crore, split between a 6% rise in individual business premium (Rs 75,416 crore) and a faster 9% increase in group business premium (Rs 51,834 crore).
On an annualised premium equivalent (APE) basis, the metric insurers use to compare products of different tenures, total premium came in at Rs 13,692 crore, with individual business contributing 55% and group business the remaining 45%. LIC sold 31.02 lakh individual policies during the quarter, up 2% YoY.
Q1 FY27 vs Q1 FY26: Key Numbers at a Glance
| Metric | Q1 FY27 | Q1 FY26 | YoY Change |
|---|---|---|---|
| Net Profit | Rs 13,492 cr | Rs 10,986 cr | +23% |
| Net Premium Income | ~Rs 1.27 lakh cr | ~Rs 1.19 lakh cr | +7% |
| Individual Premium | Rs 75,416 cr | Rs 71,474 cr | +6% |
| Group Premium | Rs 51,834 cr | Rs 47,726 cr | +9% |
| Value of New Business (VNB) | Rs 3,136 cr | Rs 1,944 cr | +61% |
| VNB Margin | 22.9% | 15.4% | +750 bps |
| AUM | Rs 59.39 lakh cr | Rs 57.05 lakh cr | +4% |
| Solvency Ratio | 2.42 | 2.17 | +0.25 pts |
Product Mix Shift Is Doing the Heavy Lifting
The real story behind the margin jump is mix, not volume. Within individual business APE of Rs 7,532 crore, participating products still dominate at 67.51% (Rs 5,085 crore), but non-participating products have climbed to 32.49% (Rs 2,447 crore) of the mix, up from 30.34% a year ago, and 14% higher in absolute terms.
Non-par products typically carry fatter margins than traditional par policies, which explains why VNB margin expanded by a sharp 750 basis points even though premium growth itself stayed in high single digits.
Persistency Ratios: A Mixed Show
Persistency, how many policyholders keep paying premiums over time, sent conflicting signals this quarter.
| Basis | Period | Q1 FY27 | Q1 FY26 |
|---|---|---|---|
| By Premium | 13th month | 75.33% | 75.63% |
| By Premium | 61st month | 61.12% | 63.85% |
| By Number of Policies | 13th month | 66.45% | 64.35% |
| By Number of Policies | 61st month | 48.74% | 51.12% |
Persistency measured by policy count improved at the 13-month mark but weakened at the 61-month mark, an inverse pattern showed up on the premium basis. Long-tenure retention (61st month) declined on both metrics, which is worth tracking in coming quarters.
Market Share and Balance Sheet Health
LIC held onto its position as India’s dominant life insurer, with a 60.1% overall market share by first-year premium income, 38.89% in individual business and 70.9% in group business, per IRDAI data cited in the company’s own disclosure. Assets under management grew 4% YoY to Rs 59.39 lakh crore, and the solvency ratio, a measure of the insurer’s ability to meet claims, improved to 2.42 from 2.17.
On costs, the overall expense ratio ticked up to 10.63% from 10.47%, a rise of 16 basis points, while the yield on investments in the policyholders’ fund (excluding unrealised gains) eased to 8.28% from 8.45% a year earlier.
Also Check: LIC Option Chain (LICI) — Live OI, IV, Greeks & PCR
Government OFS Concludes, Public Holding Hits 10%
The earnings land alongside a separate but connected development. The Centre has completed its Offer for Sale of up to 6.5% in LIC, raising Rs 31,552 crore after fully exercising the green shoe option amid strong investor demand, with more than 82.23 crore shares allotted to retail and institutional investors.
The transaction lifts LIC’s public shareholding to 10%, bringing the insurer into compliance with SEBI’s minimum public shareholding norms ahead of the May 2027 deadline. The OFS floor price was fixed at Rs 382 a share, and the stock has traded below its pre-OFS levels since the sale was announced. On Thursday, LIC shares slipped over 1% in early deals, changing hands near Rs 387 on the NSE.
Management’s Key Message
LIC’s CEO and MD, R Doraiswamy, credited the quarter’s market share retention to the insurer’s distribution and product diversification strategy, pointing to the sharp rise in VNB and the margin expansion as evidence that the shift toward higher-margin, non-par products is paying off even as competition in the life insurance space intensifies.
NiftyTrader Desk View
LIC’s Q1 print is genuinely strong on the metrics that matter most for a life insurer’s long-term value, VNB growth and margin expansion, and the non-par push looks to be working. But the stock’s near-term price action is being driven less by these operating numbers and more by fresh supply from the government’s OFS, which has weighed on the counter over the past two sessions.
Worth watching: whether the persistency softness at the 61st-month mark is a one-off or the start of a trend, and whether the promised institutional and index-inclusion flows tied to the higher public float eventually show up in volumes. This section reflects editorial analysis for informational purposes only and is not investment advice.
Read Next: Blue Star Q1 FY27 Results on August 6, Earnings Call August 7: All Eyes on Margins and AC Demand
Disclaimer: This article is for informational purposes only and does not constitute investment advice. Investments in securities markets are subject to market risks. Readers are advised to consult a registered financial advisor and independently verify data, including through NSE/BSE filings, before making any investment decisions. NiftyTrader and the author accept no liability for decisions made based on this content.