
US equity funds attracted $64 billion after the Federal Reserve’s September 16 rate hike, while India-focused funds saw their biggest weekly outflow in seven weeks. The split extends to gold and high-yield credit, revealing a more complicated global liquidity shift.
Global investors have started moving money in different directions after the US Federal Reserve’s latest rate decision.
US equity funds attracted $64 billion during the week, their strongest inflow in three months, while India-focused funds recorded $496 million of outflows, their highest weekly redemption in seven weeks, according to Elara Securities’ latest Global Liquidity Tracker. Global emerging-market funds also turned negative, recording their first outflow in 10 weeks at $877 million.
The striking part is that this is not a simple risk-off trade. Gold continued to pull in money, while high-yield bond funds suffered their biggest outflow in six months. At the same time, US equities remained a major destination for fresh capital.
That divergence is now a key signal for investors watching where global liquidity is moving next.
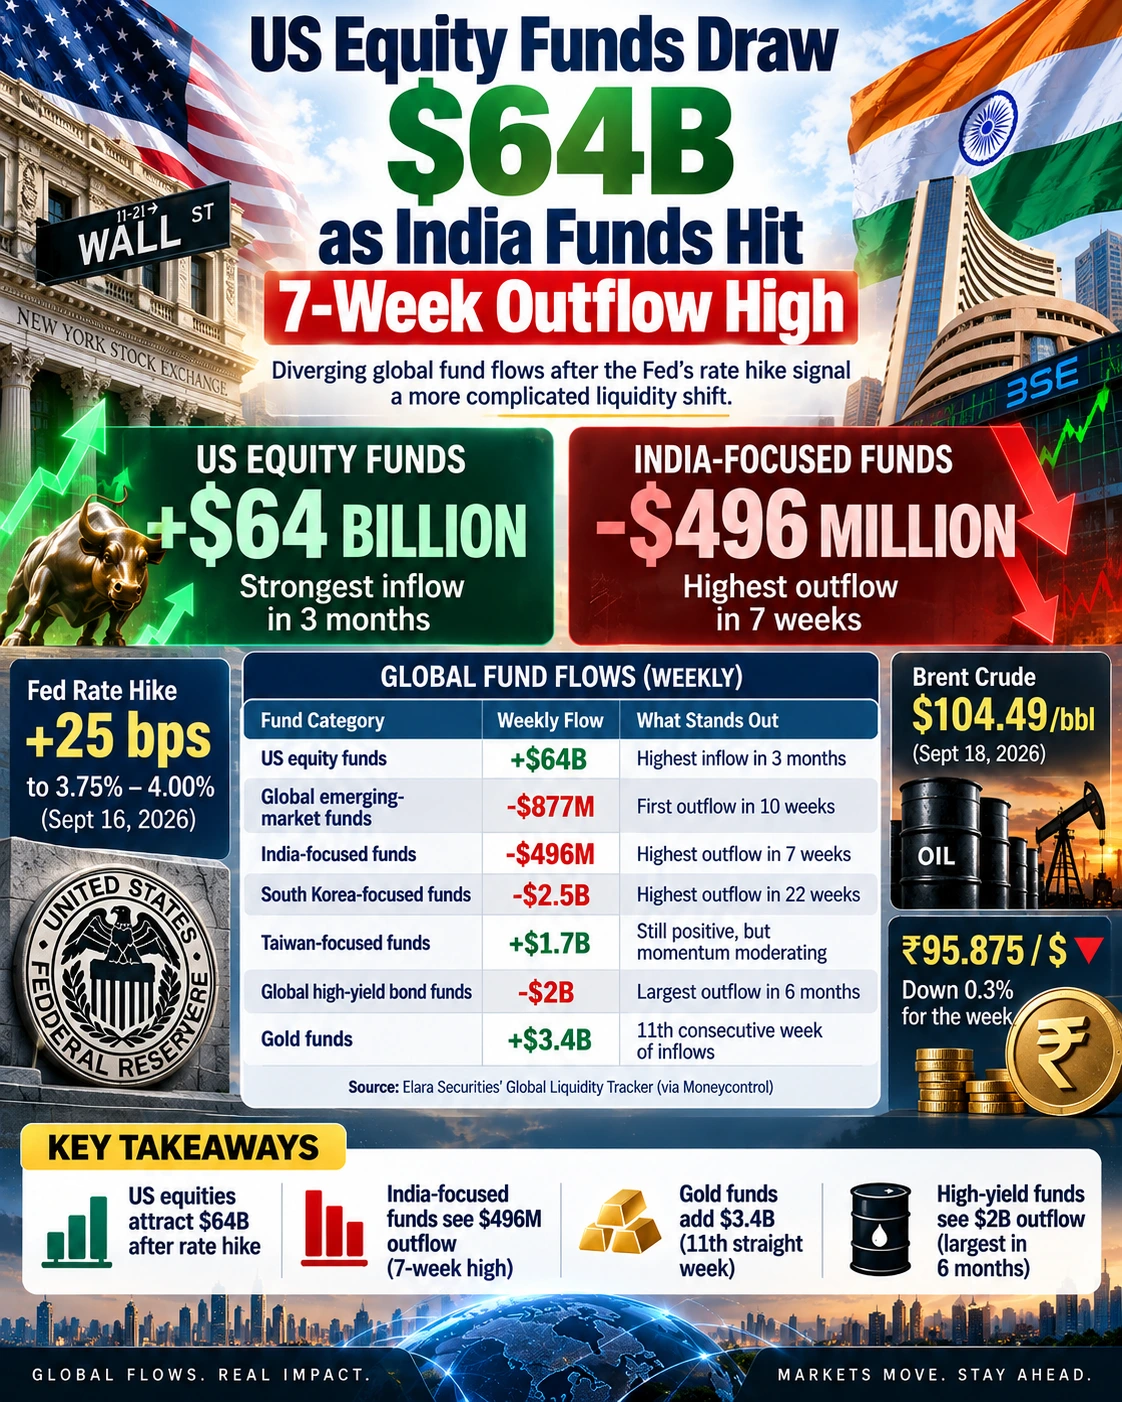
US equity funds rebound after the Fed decision
The Federal Reserve raised its target federal funds rate by 25 basis points to 3.75%-4% on September 16, with the FOMC voting unanimously for the move. The central bank said economic activity was expanding at a solid pace, domestic spending remained resilient, productivity growth was strong and capital investment was robust, although inflation remained elevated and uncertainty was still high.
Elara said the flow divergence suggested a relative reallocation towards US equities after the Fed decision, with most of the $64 billion flowing into domestic ETFs.
That creates an unusual expectation gap: a rate hike typically raises the hurdle for equity valuations, yet US equity funds still recorded their strongest inflow in three months.
One possible explanation is that investors are distinguishing between tighter monetary policy and the underlying US growth outlook. The Fed itself described economic activity as solid rather than showing signs of a sharp deterioration. Reuters also reported that the central bank signalled further rate increases could follow, keeping the path of US yields and inflation central to the market debate.
The sustainability of those US equity inflows, however, remains uncertain if Treasury yields continue climbing.
India-focused funds hit a 7-week outflow high
India was on the other side of the flow equation.
India-focused funds saw $496 million leave during the week, the highest weekly outflow in seven weeks. The redemptions were almost evenly split:
| India-focused fund category | Weekly outflow |
|---|---|
| Long-only funds | $251 million |
| ETFs | $245 million |
| Total | $496 million |
Elara said the recent rise in crude oil prices could be contributing to the pressure on India-focused funds.
The timing matters. Indian equities ended the week lower for a sixth consecutive week, their longest losing streak since 2020, with the Nifty 50 down 0.22% and the Sensex lower by 0.65% for the week. Reuters attributed the pressure partly to crude prices above $100 a barrel and tighter global monetary conditions reducing the relative appeal of Indian equities to foreign investors.
But there is an important distinction for readers: the $496 million figure refers to India-focused funds, not total foreign portfolio investor selling in Indian stocks.
Fund flows into dedicated India vehicles can reflect subscriptions, redemptions and ETF activity and should not automatically be treated as a direct measure of FPI/FII transactions on Indian exchanges.
CHECK LIVE: NIFTY50, SENSEX, FII DII DATA | NIFTYTRADER
Why crude oil matters more for India now
The oil backdrop makes the India flow story more sensitive.
Brent crude was around $104.49 a barrel on September 18, while West Texas Intermediate was around $102.79. Reuters said supply disruptions linked to Middle East tensions continued to keep oil markets on edge.
For India, persistently elevated crude prices can create pressure through the import bill, inflation expectations and the currency.
The rupee ended the week at ₹95.875 per US dollar, down 0.3% for the week. Reuters reported that rising global interest-rate expectations and higher oil prices were among the factors weighing on the currency, with traders also watching the ₹96 level closely.
That leaves Indian assets facing a three-way external pressure point: US yields, crude oil and the dollar.
If those variables remain elevated together, the relative attractiveness of emerging-market allocations could stay under pressure. That is a risk to monitor, rather than a conclusion that India is entering a sustained foreign-capital exit.
Emerging markets are seeing selective rather than uniform selling
The broader emerging-market picture is also mixed.
Global emerging-market funds recorded $877 million of outflows, their first redemption in 10 weeks. South Korea-focused funds saw an even sharper move, losing $2.5 billion, the largest outflow in 22 weeks.
Taiwan moved in the opposite direction, attracting $1.7 billion of inflows, although Elara said the underlying flow trend was beginning to show signs of moderation.
| Market | Weekly fund flow | Signal |
|---|---|---|
| India-focused funds | -$496M | 7-week outflow high |
| Global EM funds | -$877M | First outflow in 10 weeks |
| South Korea-focused funds | -$2.5B | 22-week outflow high |
| Taiwan-focused funds | +$1.7B | Inflows, but moderation emerging |
This matters because the latest data does not suggest investors are simply abandoning all emerging markets. Capital is being differentiated across markets rather than moving uniformly in or out of the segment.
The bigger warning may be in high-yield bonds
The most important forward-looking signal in Elara’s report could be in credit rather than equities.
Global high-yield bond funds recorded a $2 billion outflow, their largest in six months. Elara said the latest redemption remains modest compared with the much larger outflow cycle between October 2021 and October 2023, when US Treasury yields entered a prolonged rise.
The research firm also noted that earlier outflow episodes in February-April 2026 and March-April 2025 were largely driven by geopolitical and tariff-related shocks.
The current episode is worth watching because the nature of the pressure could change.
Elara said investors should monitor whether the move remains event-driven or develops into a broader rates-driven redemption cycle. A sustained break above the 5% zone for the US 10-year Treasury yield, combined with Fed tightening and elevated inflation, could put additional pressure on high-yield valuations and potentially accelerate redemptions.
That is the key uncertainty in the latest liquidity picture.
Gold keeps attracting money
While equity and credit flows diverged, gold continued to attract strong investor demand.
Gold funds recorded $3.4 billion of inflows, extending their streak to 11 consecutive weeks and taking the run into a third month.
The combination is notable.
Investors are simultaneously putting money into US equities and gold while pulling money from high-yield credit and several emerging-market categories.
That does not fit neatly into a conventional “risk-on” or “risk-off” label. Instead, it points to a market where investors are balancing growth exposure with protection against inflation, rates and geopolitical uncertainty.
Sector flows add another layer to the rotation
Elara also highlighted renewed demand for global sector funds.
Global consumer-goods funds attracted $1.37 billion, their biggest inflow since April 2023, after a prolonged period of outflows. Global industrial funds attracted another $1.2 billion, their strongest inflow in six weeks.
However, the technical backdrop for industrials was less straightforward. Elara noted that the Global Industrial Index had moved marginally below its 200-day moving average for the first time since March 2025, making the level an important technical marker to watch.
This again reinforces the broader message: fresh money is appearing in some parts of the market, but the underlying signals are not uniformly bullish or defensive.
What investors should watch next
The latest fund-flow data leaves four variables particularly important for the next phase of the global allocation story.
US 10-year Treasury yield: A sustained move above 5% could increase pressure on high-yield valuations and make US fixed-income assets relatively more attractive.
Crude oil: Brent remains above $100, keeping India’s inflation, trade-balance and currency risks in focus.
Rupee: The ₹96-per-dollar zone has become a closely watched level as global rates and oil pressure emerging-market currencies.
High-yield redemptions: The key question is whether the latest $2 billion withdrawal remains a short-lived event or begins to resemble a broader rates-led credit outflow.
The global money map is splitting — and India is feeling it
The latest Elara data is more revealing than a simple headline about money leaving India.
US equity funds gained $64 billion. India-focused funds lost $496 million. High-yield bond funds lost $2 billion. Gold gained $3.4 billion.
The market tension lies in what happens next.
US growth resilience can continue to support American equities, but higher rates and Treasury yields could eventually challenge valuations. India can remain attractive on domestic fundamentals, but elevated crude prices, a weaker rupee and higher global yields can complicate foreign allocations.
For now, the clearest signal is not a wholesale flight from risk. It is selective repositioning across equities, emerging markets, credit and safe-haven assets.
The next few weeks should show whether that divergence is temporary positioning around the Fed decision or the beginning of a more persistent change in global liquidity.
Need to Know
$64B: Weekly inflow into US equity funds.
$496M: Weekly outflow from India-focused funds.
$2B: Outflow from global high-yield bond funds.
$3.4B: Weekly inflow into gold funds.
11 weeks: Gold funds’ consecutive inflow streak.
Read Next: JioBlackRock’s New Fund Has the Model. Where Is the Track Record?
Disclaimer: This article is for informational purposes only and does not constitute investment advice. Fund-flow figures can vary based on the fund universe, methodology and reporting period. Individual flow data should not be treated as a standalone indicator of future market performance.