
National Stock Exchange (NSE) shares closed at a record ₹2,070.05 on November 16, taking its market value above LIC’s. With the stock up 16% from its IPO price, NSE’s latest earnings reveal strong transaction revenue, a 23% rise in quarterly profit and a crucial distinction between reported and underlying growth.
Note: All share prices, market capitalisations and company rankings mentioned in this article are based on November 16, 2026, closing data, unless otherwise stated.
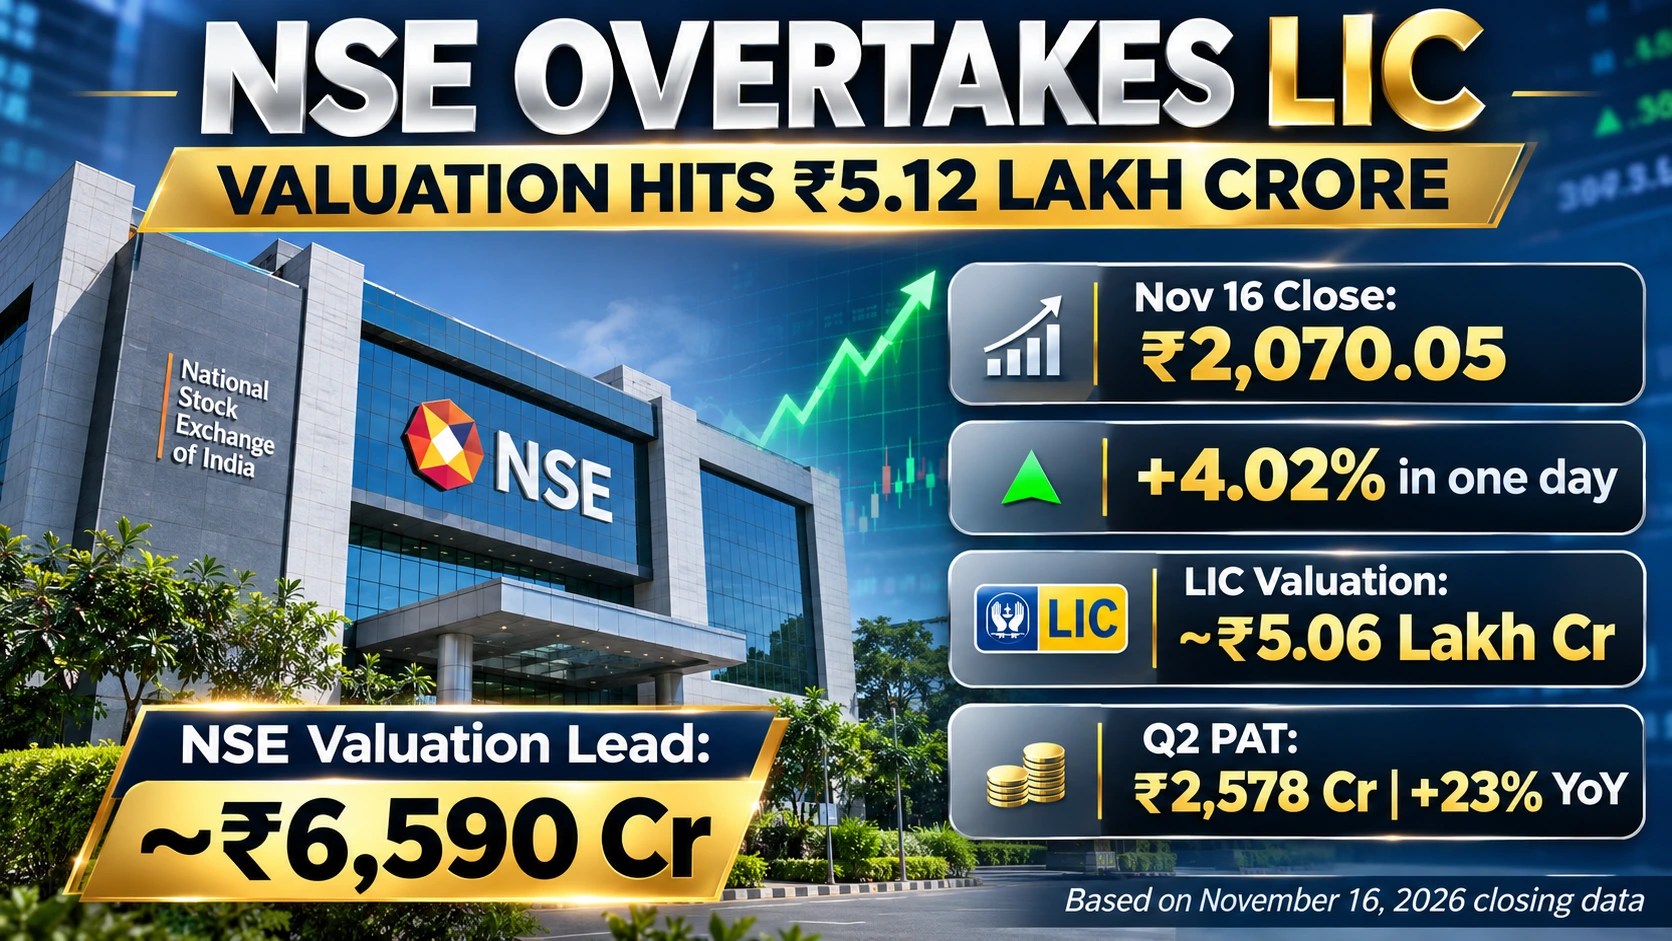
NSE Share Price and Market Capitalisation, November 17, 2026: The National Stock Exchange of India (NSE) crossed ₹5 lakh crore in market capitalisation for the first time on Monday, November 16, after its shares surged 4.02% to a record closing price of ₹2,070.05 on the BSE.
The rally lifted NSE’s valuation to approximately ₹5.12 lakh crore, overtaking Life Insurance Corporation of India (LIC), valued at around ₹5.05–5.06 lakh crore. The milestone made NSE India’s 10th most valuable listed company by market capitalisation at Monday’s close.
The achievement comes less than two months after NSE’s September 24 stock market debut. However, the exchange’s latest quarterly results reveal a more detailed picture: strong profitability, substantial transaction-related income and important one-off adjustments affecting year-on-year earnings comparisons.
Track Live: NSE Option Chain Live — Nifty, Bank Nifty & All F&O Stocks
NSE Share Price Hits ₹2,074 Intraday High; Gains 16% From IPO Price
NSE shares advanced ₹80, or 4.02%, from the previous close of ₹1,990.05 to end November 16 at ₹2,070.05. During the session, the stock touched an intraday record of ₹2,074 before settling slightly below that level.
The closing price represents a gain of approximately 16% from NSE’s IPO issue price of ₹1,785. Shares have also recovered around 26.2% from the intraday low of ₹1,640.25 recorded on October 23.
NSE made its stock market debut on the BSE on September 24 after completing an IPO worth approximately ₹22,563 crore. The issue consisted entirely of an offer for sale by existing shareholders, meaning the proceeds went to selling shareholders rather than directly to NSE.
NSE Outperforms Sensex Between November 2 and November 16
NSE shares rose 16.3% between their November 2 closing price of ₹1,779.70 and the November 16 close of ₹2,070.05.
Over the same closing-price comparison period, the BSE Sensex gained approximately 8.5%, rising from 75,692.78 to 82,104.79.
| Performance comparison | Change |
|---|---|
| NSE shares, Nov 2–16 | +16.3% |
| BSE Sensex, Nov 2–16 | +8.5% |
| NSE versus IPO issue price | +16.0% |
| NSE versus October 23 intraday low | +26.2% |
Source: Historical market prices. The November comparison uses closing prices on November 2 and November 16, not the conventional previous-month-end base. The October-low comparison uses an intraday price.
The outperformance highlights the pace of NSE’s recent rally, although past share-price gains do not establish the direction of future trading.
NSE vs LIC: How Much Is the Valuation Gap?
NSE’s market value reached approximately ₹5,12,337 crore at Monday’s closing price, putting it ahead of India’s largest life insurer.
| Company | Market capitalisation |
|---|---|
| National Stock Exchange | ₹5,12,337 crore |
| Life Insurance Corporation | Approximately ₹5,05,747 crore |
| Indicative valuation difference | Approximately ₹6,590 crore |
Market values as of November 16, 2026, using reported BSE-linked closing valuations. Figures may vary slightly across market-data providers.
The comparison highlights NSE’s growing equity-market valuation, but it does not mean the exchange has a larger operating business, revenue base or asset portfolio than LIC.
Market capitalisation reflects the value investors assign to a company’s outstanding equity shares. An exchange operator and a life insurer have fundamentally different revenue models, risk exposures and balance-sheet structures.
For NSE shareholders, the more relevant question is whether the exchange’s earnings growth can support its valuation.
Track Live: LIC Option Chain (LICI) — Live OI, IV, Greeks & PCR
NSE Q2 FY27 Results: PAT Rises 23%, Revenue Grows 11%
NSE’s audited consolidated financial results for the September quarter, announced on November 3, show continued growth in its core business.
Consolidated profit after tax increased 23% year-on-year to ₹2,578 crore from ₹2,098 crore. Revenue from operations rose 11% to ₹4,067 crore, while total income grew 9% to ₹4,554 crore.
| Financial metric | Q2 FY27 | Q2 FY26 | YoY change |
|---|---|---|---|
| Revenue from operations | ₹4,067 Cr | ₹3,677 Cr | +11% |
| Total income | ₹4,554 Cr | ₹4,160 Cr | +9% |
| Consolidated PAT | ₹2,578 Cr | ₹2,098 Cr | +23% |
| Normalised operating EBITDA | ₹3,079 Cr | ₹2,782 Cr | +11% |
Source: NSE’s audited consolidated financial results and investor presentation dated November 3, 2026. Figures are rounded to the nearest crore.
While annual profit growth was positive, the sequential performance was weaker. Consolidated PAT declined approximately 17% from ₹3,120 crore in Q1 FY27, while revenue from operations fell 11% quarter-on-quarter.
The difference between year-on-year growth and sequential moderation is important when assessing quarterly earnings momentum.
Why NSE’s 107% Reported EBITDA Growth Needs Context
One of the most important details in NSE’s results is the difference between reported and normalised operating EBITDA growth.
Reported operating EBITDA rose 107% year-on-year to ₹3,079 crore from ₹1,484 crore. However, the year-earlier quarter included a ₹1,297 crore provision for SEBI settlement fees related to historical regulatory matters.
After adjusting for that provision, NSE’s Q2 FY26 normalised operating EBITDA was ₹2,782 crore. On this comparable basis, Q2 FY27 operating EBITDA increased approximately 11%, not 107%.
The prior-year quarter also included a separate ₹1,201 crore gain from the sale of an investment in associates. That gain affects the broader profit comparison and is distinct from the settlement provision used to normalise operating EBITDA.
The distinction is significant: NSE’s reported earnings figures show strong growth, but the underlying operating improvement is more moderate than the headline EBITDA increase suggests.
Also Check: Nifty Option Chain Live — OI, IV & LTP by Strike
Transaction Charges Drive Nearly 75% of NSE’s Operating Revenue
Trading-related income remains the largest contributor to NSE’s revenue.
Transaction charges increased 9% year-on-year to ₹3,035 crore during Q2 FY27, compared with ₹2,789 crore a year earlier. They accounted for approximately 74.6% of consolidated revenue from operations.
The exchange’s cash-market average daily traded value increased 24% year-on-year to ₹1,18,377 crore. Equity-options average daily premium traded value grew 3% to ₹47,977 crore, although it declined 25% sequentially from the June quarter.
This shows that the exchange’s earnings depend not only on long-term growth in market participation but also on how trading activity changes across segments and quarters.
NSE’s other services delivered growth as well. Listing services revenue increased 70% to ₹150 crore, while data feed and terminal services revenue rose 43% to ₹165 crore.
These businesses provide additional revenue streams, although transaction charges continue to dominate NSE’s income mix.
Is NSE’s ₹5.12 Lakh Crore Valuation Supported by Earnings?
At the November 16 closing price of ₹2,070.05, NSE shares were valued at approximately 49.7 times the company’s reported FY26 consolidated earnings per share of ₹41.62.
This is a historical price-to-FY26 EPS multiple. It should not be confused with a trailing 12-month P/E calculated from the latest four quarters or a forward valuation based on projected earnings.
The multiple indicates the price investors were paying relative to NSE’s FY26 earnings. Whether that valuation is sustainable will depend on future profitability, market activity, competitive conditions and the broader regulatory environment.
NSE’s November investor presentation reported a 93% share of India’s cash equity market and 68% share of equity options for H1 FY27, based on the company’s respective market-share measures.
These figures demonstrate the exchange’s position in the specified trading segments. They should not be interpreted as NSE’s share of all financial-market activity in India.
What Could Influence NSE Shares After the ₹5 Lakh Crore Milestone?
NSE’s market position provides exposure to trading, listings, clearing, market data and related services. However, several factors could influence its future earnings and valuation.
Trading volumes and the mix of activity across cash and derivatives markets remain important because transaction charges contribute nearly three-quarters of operating revenue. Changes in derivatives regulations, market participation or trading patterns could affect that income.
Competition, technology investment, cybersecurity requirements and the ability to expand non-transaction revenue are also relevant to long-term performance.
The exchange’s latest results offer evidence of a profitable and expanding business, but the November 16 rally cannot be attributed solely to earnings announced nearly two weeks earlier.
The Bottom Line
NSE’s move above ₹5 lakh crore in market capitalisation is a significant milestone for India’s newly listed exchange operator. Its record closing price of ₹2,070.05 placed it ahead of LIC and approximately 16% above its IPO issue price.
Yet the more revealing numbers are in the financial results. While reported PAT grew 23% year-on-year, normalised operating EBITDA increased 11%, reflecting a more measured underlying performance after accounting for the prior-year regulatory provision.
With transaction charges accounting for nearly 75% of operating revenue, NSE’s ability to sustain earnings growth will remain closely linked to trading activity, market structure and regulatory developments.
For investors, the important question following the valuation milestone is whether future operating performance can keep pace with the expectations reflected in the share price.
Read Next: Stocks to Watch Today, Nov 17: Pace’s ₹2,691-Cr Win, BSE’s US Nod, Kaynes’ Profit Slump
Disclaimer: This report is for informational and educational purposes only and does not constitute investment advice or a recommendation to buy or sell any security.