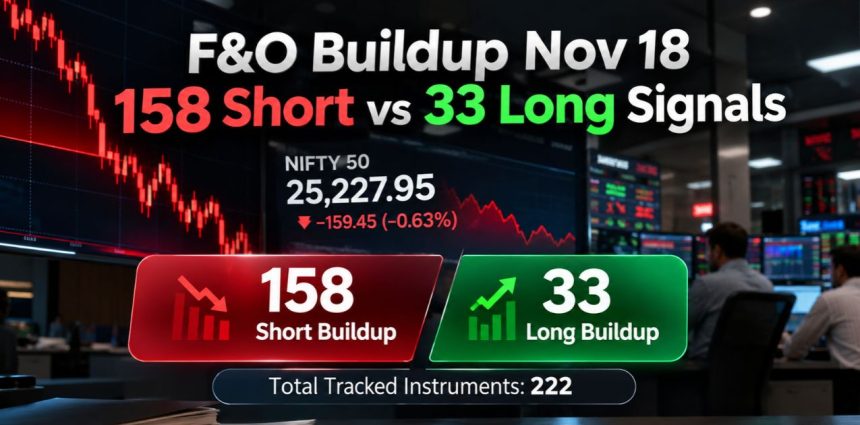
NiftyTrader’s November 18 closing OI Spurts snapshot showed short-buildup signals dominating 222 tracked F&O instruments as the Nifty 50 fell 0.63%. Motherson, Tata Steel and Hindalco featured among prominent short-buildup stocks, although final NSE futures OI data showed materially different readings.
Indian equity markets ended lower on Wednesday, November 18, with the Nifty 50 declining 159.45 points, or 0.63%, to 25,227.95, while the Sensex fell 500.38 points, or 0.61%, to 82,031.81.
Against this backdrop, NiftyTrader’s 3:50 PM IST OI Spurts snapshot recorded 158 short-buildup signals and 33 long-buildup signals across 222 tracked instruments.
The short-buildup count was nearly 4.8 times the long-buildup count, highlighting the concentration of negative price-and-open-interest combinations in the scanner’s closing readings.
However, a separate calculation using the NSE’s November 18 UDiFF Final futures bhavcopy produced materially different classifications. The two datasets should therefore not be treated as interchangeable.
Track Live: NiftyTrader OI Spurts
F&O Buildup November 18: Scanner Classification
NiftyTrader’s closing snapshot showed the following distribution:
| Classification | Instruments | Share |
|---|---|---|
| Short buildup | 158 | 71.17% |
| Long buildup | 33 | 14.86% |
| Long unwinding | 7 | 3.15% |
| Short covering | 5 | 2.25% |
| Neutral | 19 | 8.56% |
| Total | 222 | 100% |
Source: NiftyTrader OI Spurts, November 18, 2026, 3:50 PM IST. Percentages are rounded.
The dataset included 218 stock symbols and four index symbols. All four index symbols were classified as neutral in the snapshot.
Short buildup conventionally describes falling prices alongside rising OI, while long buildup involves rising prices and rising OI.
These combinations are indicators of derivatives positioning. They do not independently identify who initiated the positions or establish future market direction.
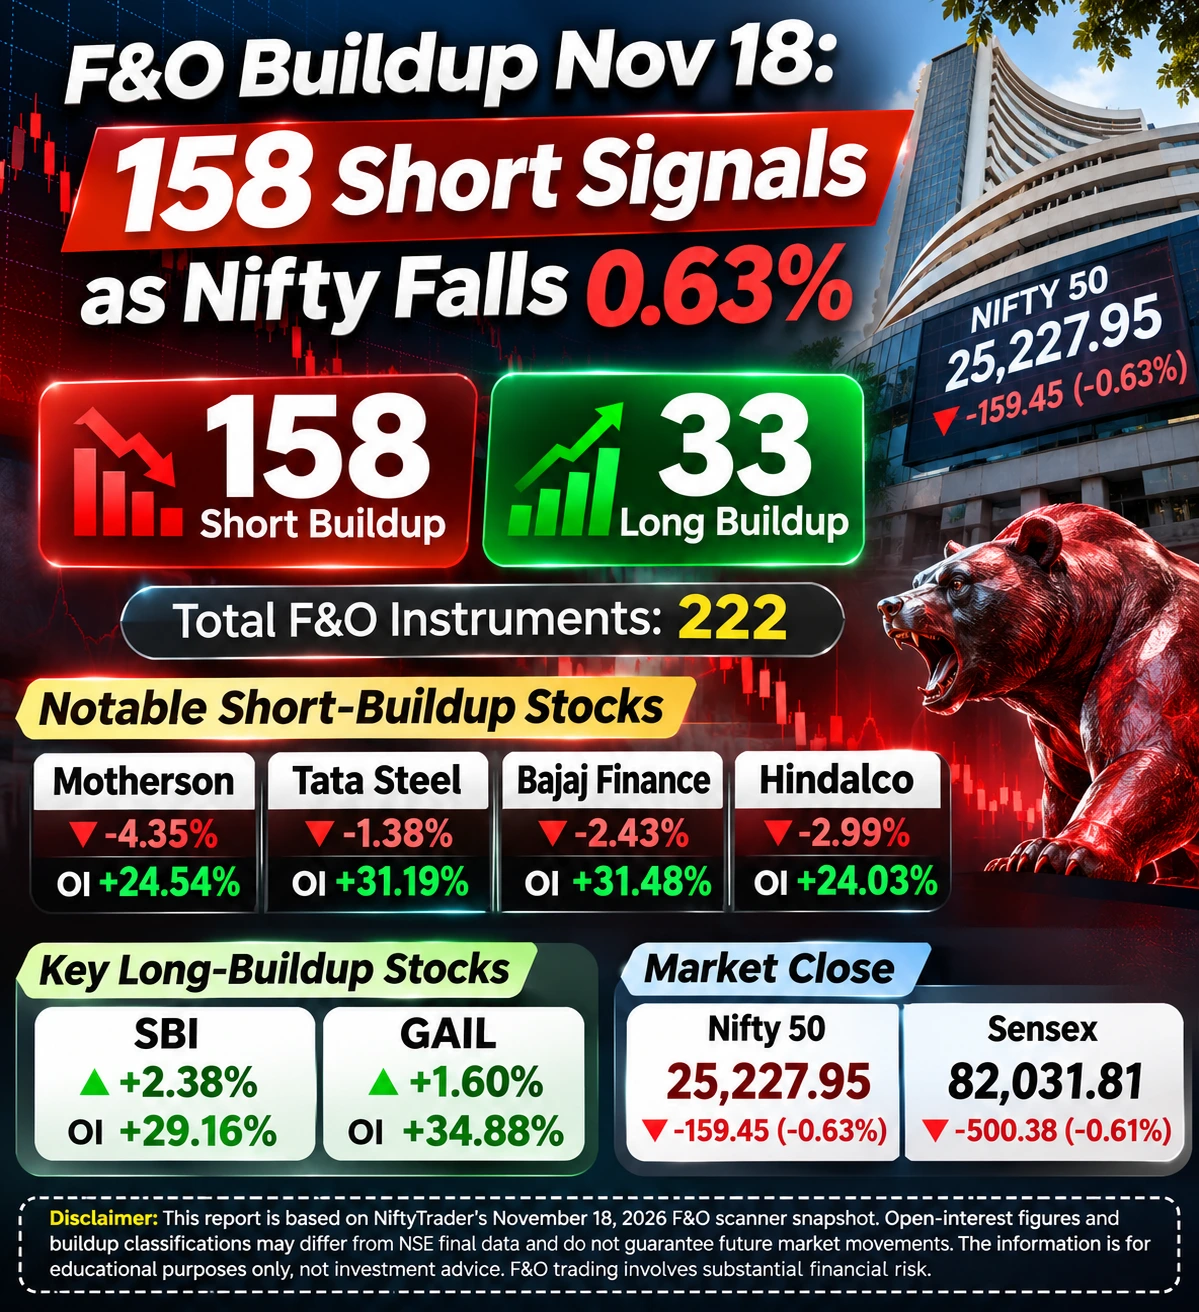
Motherson, Tata Steel and Hindalco Feature Among Short-Buildup Signals
Several widely traded stocks recorded negative price changes and positive OI changes in NiftyTrader’s scanner.
| Stock | Price change | Scanner OI change |
|---|---|---|
| Motherson | -4.35% | +24.54% |
| Tata Steel | -1.38% | +31.19% |
| Bajaj Finance | -2.43% | +31.48% |
| Eternal | -2.41% | +25.77% |
| Hindalco | -2.99% | +24.03% |
| Vedanta | -3.78% | +26.19% |
Figures above are from NiftyTrader’s 3:50 PM scanner and are not NSE-final aggregate OI changes.
The readings coincided with pressure across metal and consumer-related shares.
The Nifty Metal Index declined 2.46%, while the Nifty Consumer Durables Index lost approximately 3%. The Nifty Auto and Nifty IT indices also closed lower.
The NSE UDiFF Final file retained positive aggregate OI changes for Motherson, Tata Steel, Hindalco and Vedanta. Bajaj Finance, however, showed a slight decline in final aggregate OI, rather than the increase displayed by the earlier scanner.
Strong Q2 Results Contrast With Weak Share-Price Performance
Several companies appearing in NiftyTrader’s short-buildup list had reported strong quarterly financial results earlier in November.
Samvardhana Motherson International reported Q2 FY27 consolidated revenue of ₹38,280 crore, up 27% year-on-year. EBITDA stood at ₹3,353 crore and normalised profit after tax at ₹1,175 crore. The company also reported an order book described as booked business of $106 billion.
Tata Steel reported consolidated quarterly revenue of ₹65,436 crore and EBITDA of ₹10,665 crore, up 17% year on year. Consolidated net debt stood at ₹91,423 crore, with net debt-to-EBITDA at 2.4 times.
Hindalco posted consolidated revenue of ₹91,708 crore, an increase of 39%, while EBITDA rose 42% to ₹13,757 crore. Consolidated PAT climbed 59% to ₹7,533 crore.
Bajaj Finance, meanwhile, disclosed on November 17 that it had allotted 114,146,341 equity shares through a qualified institutions placement at ₹1,025 per share, aggregating approximately ₹11,700 crore.
These corporate disclosures provide financial context for the stocks. They do not establish that quarterly results or the QIP caused the November 18 price movements.
SBI and GAIL: Scanner Long Buildup, Final OI Decline
SBI and GAIL stood out from the broader negative market trend in NiftyTrader’s closing snapshot.
SBI advanced 2.38% to ₹1,135, with the scanner displaying a 29.16% increase in aggregate OI. GAIL gained 1.60% to ₹190, accompanied by a displayed 34.88% OI increase.
Both were consequently classified as long buildup by the scanner.
The NSE UDiFF Final futures file showed a different outcome. SBI’s final aggregate OI declined approximately 6.25%, while GAIL’s fell 0.45%.
Using their positive price changes and the final OI movements, both would fall into the conventional short-covering category under a simple price/OI classification.
The discrepancy underlines the importance of distinguishing an earlier scanner observation from a final contract-level calculation.
Final NSE Futures Data Shows a Different Buildup Distribution
A reconciliation of the same 222 tracked instruments using NiftyTrader’s closing price-change signs and the NSE UDiFF Final futures OI changes produced 86 short-buildup and 18 long-buildup classifications.
It also identified 86 long-unwinding and 26 short-covering patterns, with six instruments unclassified because their recorded price change or OI change was zero.
These results are calculated classifications, not figures published by NSE as a buildup report.
The calculation combines futures open-interest changes across available November 23, December 29 and January 25 contracts.
The divergence matters because OI can change significantly between expiry contracts. For Tata Steel, for example, final November-contract OI declined substantially, while the December contract OI increased, leaving a much smaller positive aggregate change.
The final OI data also differs materially from the separately uploaded November 18 DAT bhavcopy. The cause of that disagreement remains unresolved.
What F&O Traders Should Watch Next
With the November 23 futures expiry approaching, traders should examine near-month OI reductions alongside changes in December and January contracts.
A fall in near-month OI accompanied by higher next-month OI may reflect rollover activity, but the available figures do not independently identify how much exposure was rolled over.
The November 18 data illustrates how derivatives signals can vary depending on the source, timing and aggregation method used.
Bottom line: NiftyTrader’s closing scanner flagged 158 short-buildup signals against 33 long-buildup signals. A separate NSE-final futures OI calculation produced 86 price-down, OI-up patterns. Both figures require clear source attribution and should not be interpreted as forecasts of the next trading session.
Read Next: Nvidia Q3 Revenue Jumps 103%: Why Did TCS and Infosys Fall?
Disclaimer: This report is based on NiftyTrader’s November 18, 2026 F&O scanner snapshot. Open-interest figures and buildup classifications may differ from NSE final data and do not guarantee future market movements.
The information is for educational purposes only, not investment advice. F&O trading involves substantial financial risk.