
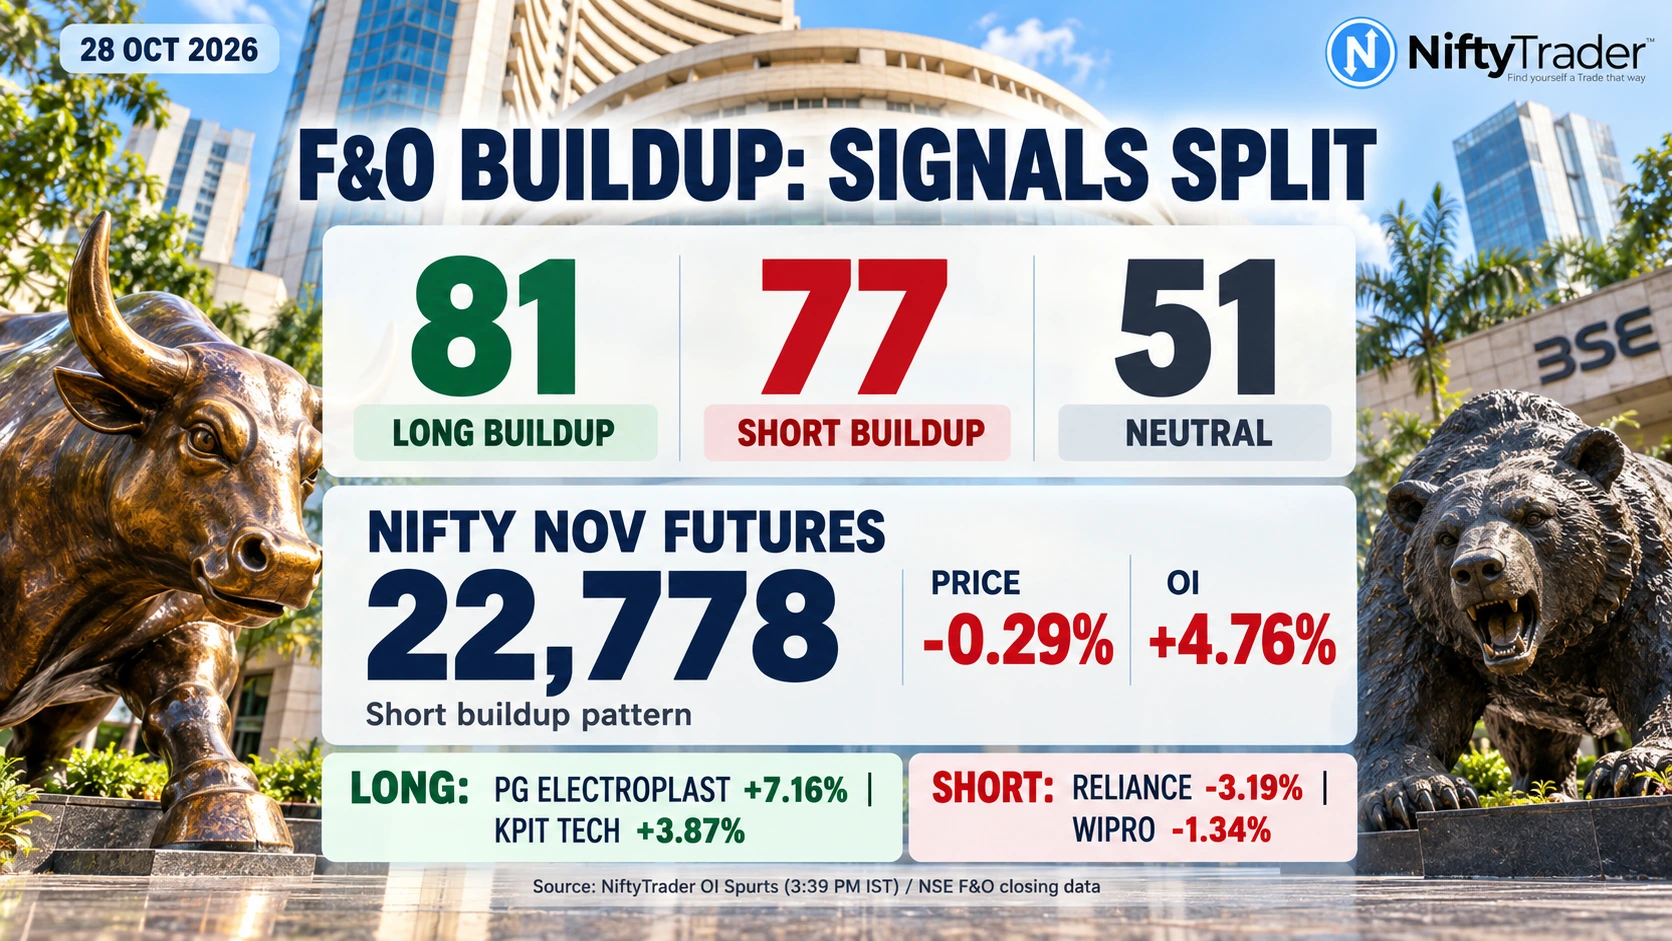
The gap between bullish and bearish derivatives signals narrowed sharply on October 28, with NiftyTrader’s latest OI Spurts snapshot showing 81 long-buildup stocks against 77 short-buildup stocks. The number of neutral classifications jumped to 51, suggesting that the market’s stock-level positioning was becoming less clearly directional rather than decisively bearish.
The change is significant compared with October 27, when the scanner showed 113 long-buildup stocks and 66 short-buildup stocks. Long-buildup signals fell by 32, short-buildup signals increased by 11, and the difference between the two categories narrowed from 47 stocks to just four. The latest visible snapshot was updated at 3:39 PM IST on October 28. Source: NiftyTrader OI Spurts.
The closing futures data provides an additional warning. The November Nifty futures contract closed at 22,778, down 0.29% from its previous close, while open interest increased by 7,41,780 contracts, or 4.76%. December futures also declined while OI rose. Both contracts, therefore, displayed the price-and-OI combination associated with short buildup, according to the NSE end-of-day file supplied for this analysis.
The resulting picture is mixed but important: selected stocks attracted additional futures positioning during price advances, while the two main Nifty futures contracts finished lower with higher OI. This does not establish that the market must fall further. It does suggest that the breadth of bullish stock-level signals weakened while index-futures pressure remained evident.
Track Live: NSE Stock Futures Live — Price, OI, Volume, Expiry and Basis
Need to Know
- Long buildup: 81 stocks, down from 113 on October 27.
- Short buildup: 77 stocks, up from 66.
- Neutral signals: 51, compared with 15 previously.
- Stocks showing long buildup: PG Electroplast, KPIT Technologies, Cholamandalam Investment and UPL.
- Stocks showing short buildup: Reliance Industries and Wipro.
- Nifty futures: November futures closed at 22,778, down 0.29%, with OI up 4.76%; December futures fell 0.30%, with OI up 3.47%.
- Key uncertainty: Whether stock-specific strength will broaden or index-level weakness will persist remains unresolved.
1. F&O Buildup Signals: The October 28 Shift
NiftyTrader’s October 28 OI Spurts snapshot covered 222 symbols. The comparable October 27 snapshot covered 217 symbols.
| Buildup category | October 28 | October 27 | Change |
|---|---|---|---|
| Long buildup | 81 | 113 | -32 |
| Short buildup | 77 | 66 | +11 |
| Short covering | 8 | 17 | -9 |
| Long unwinding | 5 | 6 | -1 |
| Neutral | 51 | 15 | +36 |
| Total symbols | 222 | 217 | +5 |
Source: NiftyTrader OI Spurts. October 28 snapshot updated at 3:39 PM IST; comparison uses the October 27 snapshot.
The distribution changed in three important ways.
First, long buildup remained marginally ahead of short buildup, but the lead fell to four symbols. Second, the number of short-buildup classifications increased even as the number of long-buildup classifications declined. Third, neutral classifications rose from 15 to 51, making this expansion the largest change in the scanner’s distribution.
The neutral category accounted for approximately 23% of all classifications on October 28, compared with about 7% a day earlier. These percentages are NiftyTrader calculations based on the displayed counts.
The change should not be read as a direct measure of money moving from bullish to bearish trades. The scanner counts stocks, not the total capital or notional value represented by their positions. A stock with a modest OI increase counts as one classification, just as a stock with a much larger increase does.
The better interpretation is that the breadth of clearly directional signals changed. Traders need to look at the underlying prices, OI changes and trading volumes to assess the significance of individual signals. The count alone cannot determine the market’s next direction.
2. Four Stocks Showing Long Buildup
Long buildup occurs when a futures price rises alongside an increase in open interest. It indicates that the price advance coincided with more outstanding contracts, although the data alone cannot establish the intentions of every participant.
The following stocks featured in NiftyTrader’s October 28 snapshot.
| Stock | Price (₹) | Price change | Current OI | Change in OI | OI change |
|---|---|---|---|---|---|
| PG Electroplast | 536.40 | +7.16% | 1,46,81,300 | +15,85,550 | +12.11% |
| KPIT Technologies | 552.50 | +3.87% | 1,21,11,325 | +16,58,900 | +15.87% |
| Cholamandalam Investment | 1,545.20 | +5.19% | 1,42,08,700 | +12,71,200 | +9.83% |
| UPL | 536.40 | +3.35% | 3,61,79,855 | +33,79,370 | +10.30% |
Source: NiftyTrader OI Spurts, October 28, 2026, 3:39 PM IST.
PG Electroplast: The strongest price advance in this selection
PG Electroplast gained 7.16% to ₹536.40, while OI increased 12.11% to 1,46,81,300. The combination placed it among the more prominent long-buildup stocks on the scanner.
The simultaneous rise in price and OI is consistent with additional positioning during the advance. The next question is whether the stock can hold its gains and sustain participation. A reversal in price would weaken the bullish interpretation, even if OI remained elevated.
KPIT Technologies: Highest OI growth among the four
KPIT Technologies climbed 3.87% to ₹552.50, while OI increased 15.87% to 1,21,11,325. It recorded the highest percentage OI increase among these four stocks.
The combination makes KPIT worth monitoring for follow-through. However, the largest percentage increase in OI does not automatically mean the strongest bullish conviction. Price persistence, trading volume, absolute OI changes and the broader technology-sector trend also matter.
Cholamandalam Investment: Price strength accompanied by higher OI
Cholamandalam Investment rose 5.19% to ₹1,545.20 while OI climbed 9.83% to 1,42,08,700.
The pattern is consistent with long buildup. Confirmation would require the stock to retain its price gains and demonstrate continued participation in subsequent sessions.
UPL: Another positive price-and-OI combination
UPL advanced 3.35% to ₹536.40 as OI increased 10.30% to 3,61,79,855. It was among the stocks displaying additional outstanding futures positioning during a price advance.
Whether the pattern persists will depend on subsequent price action and OI changes. A stock-specific catalyst should not be inferred from the buildup classification alone; earnings announcements and other corporate developments require separate verification against exchange filings or official company disclosures.
These four stocks provide a more useful shortlist than the aggregate count alone because they identify where price strength coincided with additional futures positioning. They are not buy recommendations.
3. Reliance Industries and Wipro Show Short Buildup
Short buildup occurs when price falls while OI rises. The combination is consistent with additional outstanding futures positions during a decline.
| Stock | Price (₹) | Price change | Current OI | Change in OI | OI change |
|---|---|---|---|---|---|
| Reliance Industries | 1,158.00 | -3.19% | 16,95,67,500 | +1,37,42,000 | +8.82% |
| Wipro | 184.50 | -1.34% | 17,48,31,000 | +74,97,000 | +4.48% |
Source: NiftyTrader OI Spurts, October 28, 2026.
Reliance Industries: The sharper decline
Reliance Industries fell 3.19% to ₹1,158 while OI increased 8.82%. The stock registered the larger price decline among the two selected short-buildup names.
This suggests that the fall coincided with additional outstanding positions. The signal would be reinforced by another price decline accompanied by rising OI. A rebound with falling OI could instead indicate short covering.
The classification does not establish why Reliance shares fell or prove that all new positions were directional bearish bets. Those conclusions require additional evidence, including company disclosures and broader market conditions.
Wipro: Pressure in a weak technology sector
Wipro declined 1.34% to ₹184.50 as OI rose 4.48%.
Reuters reported that Indian IT shares were among the weakest sectors in the October 28 morning session, with the IT index down 3.1% at 9:55 AM IST. Infosys, TCS and HCLTech were also under pressure. These were early-session figures, not final closing returns.
The sector backdrop provides context for Wipro’s decline but does not prove the cause of its price-and-OI combination. The next session’s behaviour will help distinguish persistent short buildup from a temporary move.
4. Nifty Futures End Lower With Higher OI
The end-of-day figures provide a firmer basis for the index-futures conclusion than intraday readings. The October 28 file, FNO_BC28102026.DAT, records the previous close, closing price, current OI and daily change in OI for each contract.
| Nifty futures expiry | Previous close | October 28 close | Price change | Current OI | Change in OI | OI change % | Signal |
|---|---|---|---|---|---|---|---|
| November 23, 2026 | 22,843.80 | 22,778.00 | -0.29% | 1,63,14,090 | +7,41,780 | +4.76% | Short buildup |
| December 29, 2026 | 22,998.50 | 22,928.80 | -0.30% | 12,82,710 | +42,965 | +3.47% | Short buildup |
| January 25, 2027 | 23,106.50 | 23,025.80 | -0.35% | 32,760 | +32,760 | Not comparable | Low-base caution |
Source: NSE F&O Bhavcopy, October 28, 2026, supplied for this analysis. Price and OI percentages are calculated from the file. The January contract’s reported OI change equals its current OI, so a percentage change against a zero prior-OI base is not meaningful.
November futures: The stronger short-buildup signal
The November contract closed at 22,778, down 65.80 points from its previous close of 22,843.80. OI increased by 7,41,780 to 1,63,14,090, equivalent to a 4.76% increase over the previous OI base.
The price decline alongside higher OI is consistent with short buildup. It is the more substantial of the two main-contract signals because the November contract recorded a larger percentage increase in OI than December.
December futures: The same direction, smaller OI increase
December futures closed at 22,928.80, down 69.70 points from 22,998.50. OI rose by 42,965 to 12,82,710, a 3.47% increase over the previous base.
This contract displayed the same price-and-OI combination as November. The agreement between the two contracts strengthens the conclusion that the closing pattern in the main Nifty futures expiries was consistent with short buildup.
The January contract also closed below its previous close, with current OI of 32,760 and an equal reported change. However, its zero prior-OI base makes the percentage comparison unavailable, so it should not carry the same weight as the two established contracts.
Why the closing reading matters
The NiftyTrader futures dashboard showed short buildup in the November and December contracts during its 2:53 PM IST snapshot. A separate intraday trend feed subsequently displayed short unwinding at 3:40 PM. Intraday classifications can change as both prices and OI move.
The final NSE figures resolve the closing-session question: November and December finished lower than their previous closes, with higher OI. The intraday short-unwinding reading should therefore not be used as the definitive conclusion for the completed session. It describes a particular intraday movement, not the final price-and-OI combination.
The result also highlights the divergence between individual stocks and the index. Several stocks showed long buildup, but Nifty’s two principal futures contracts closed with short-buildup patterns. This is not proof that the entire market is bearish; it is evidence that stock-specific positioning and index-futures positioning were not aligned.
5. Oil Prices and the Fed Add to Market Uncertainty
The derivatives split developed against a cautious external backdrop. Reuters reported that Indian equities were under pressure during the October 28 morning session as oil prices rose ahead of the US Federal Reserve’s policy decision. Brent crude was reported at $115.40 per barrel after an attack on a Saudi Arabian refinery raised concerns about supply disruptions and inflation.
At 9:55 AM IST, the Nifty 50 was down 0.41% at 22,657.35, while the Sensex had declined 0.61% to 73,153.60. Those figures are early-session readings, not closing levels.
Three factors deserve attention:
- Crude oil: Sustained high prices can increase inflation concerns and pressure fuel-sensitive businesses, although the impact differs by sector and company.
- US monetary policy: The Federal Reserve’s decision and guidance may influence global risk appetite, currency expectations and emerging-market flows.
- Stock-specific developments: Individual companies can attract futures positioning in a direction that differs from their sector or the benchmark.
The main risk is that stock-specific advances fail to broaden while index futures remain under pressure. The opposite outcome is also possible if index positioning improves and more stocks begin participating in a recovery.
Neither scenario can be established from the OI counts alone.
6. How to Interpret Long and Short Buildup
| Price movement | OI movement | Classification | Typical interpretation |
|---|---|---|---|
| Up | Up | Long buildup | Price advance coincides with more outstanding contracts |
| Down | Up | Short buildup | Price decline coincides with more outstanding contracts |
| Up | Down | Short covering | Existing short positions may be closing |
| Down | Down | Long unwinding | Existing long positions may be closing |
These classifications are descriptive, not predictive. Every futures contract has both a buyer and a seller. Rising OI means more outstanding contracts; it does not mean buyers outnumber sellers.
Three checks are especially important before drawing a trading conclusion:
- Confirm the price trend. A single-session buildup signal is less informative if the price reverses in the next session.
- Review volume and the absolute OI change. Large percentage changes can arise from small starting bases, so percentage growth should not be considered in isolation.
- Check expiry and contract rollover. Positions shifting between expiries can affect individual-month OI changes, making comparisons across contracts less straightforward.
One further data-quality caution applies to Vodafone Idea. The October 28 OI Spurts screen displayed an OI increase of 2,204.95%, an unusually large outlier. It has not been included in the main shortlist pending validation of the underlying contract figures and base effect.
Bottom Line
The October 28 derivatives picture was less clearly bullish than the preceding session. NiftyTrader’s stock-level scan showed 81 long-buildup signals against 77 short-buildup signals, while neutral classifications rose to 51. PG Electroplast, KPIT Technologies, Cholamandalam Investment and UPL featured among the long-buildup names; Reliance Industries and Wipro showed short buildup.
The NSE closing file adds an important qualification: November Nifty futures fell 0.29% with OI up 4.76%, while December futures declined 0.30% with OI up 3.47%. Both closing combinations were consistent with short buildup, even though selected stocks displayed long buildup.
The data therefore points to a market with narrow separation between bullish and bearish stock signals, alongside weaker index-futures positioning. Whether this divergence persists or gives way to a broader directional move will depend on subsequent price and OI confirmation.
Read Next: Jio Platforms Listing: Why Nomura’s ₹1,340 Target Trails ₹1,358 Debut
Disclaimer: This article is for informational and educational purposes only and is not investment advice. Futures and options involve substantial risk and may not be suitable for all investors. Buildup classifications describe price and open-interest movements; they are not standalone buy or sell recommendations.