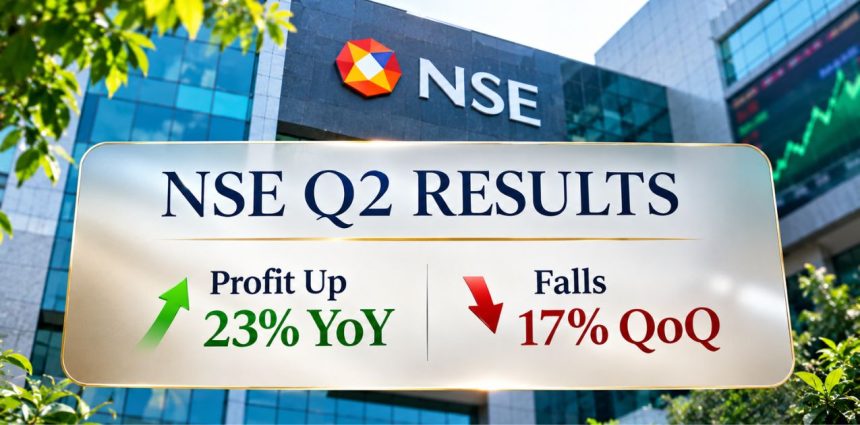
The National Stock Exchange of India (NSE) reported a 23% year-on-year (YoY) increase in consolidated profit after tax (PAT) to ₹2,578 crore for Q2 FY27. However, profit declined 17.4% sequentially as revenue from operations fell 10.8% and transaction-charge income weakened.
One important pressure point was weekly Nifty index options. Revenue from this segment declined 22% quarter-on-quarter (QoQ) to ₹1,699 crore from ₹2,170 crore in Q1 FY27. The numbers show why strong annual profit growth does not tell the complete story of NSE’s September-quarter performance.
The next test is whether trading activity stabilises in Q3 FY27, particularly across derivatives, while cash-market, listing, data and other businesses continue to support revenue.
Track Live: NIFTY50 | SENSEX | GIFT NIFTY | FII DII DATA | NIFTYTRADER
NSE Q2 FY27 Results: Profit and Revenue Fall Sequentially
NSE’s consolidated total income increased 9% YoY to ₹4,554 crore in Q2 FY27, compared with ₹4,160 crore in Q2 FY26. Revenue from operations grew 10.6% to ₹4,067 crore from ₹3,677 crore.
Consolidated PAT increased to ₹2,578 crore from ₹2,098 crore in the year-ago quarter. However, the sequential comparison was weaker.
| Consolidated financial metric | Q2 FY27 | Q1 FY27 | QoQ change |
|---|---|---|---|
| Total income | ₹4,554 cr | ₹5,252 cr | -13.3% |
| Revenue from operations | ₹4,067 cr | ₹4,560 cr | -10.8% |
| Total expenditure | ₹1,161 cr | ₹1,172 cr | -0.9% |
| Operating EBITDA | ₹3,079 cr | ₹3,551 cr | -13.3% |
| Profit after tax | ₹2,578 cr | ₹3,120 cr | -17.4% |
| EBITDA margin | 75.7% | 77.9% | Lower |
The figures show that the decline in profit was not caused by a major increase in total expenditure. Expenses remained broadly stable compared with the June quarter, while revenue from operations and total income declined.
This points to lower income generation, particularly from transaction-related activity and investments, as an important factor behind the sequential earnings slowdown.
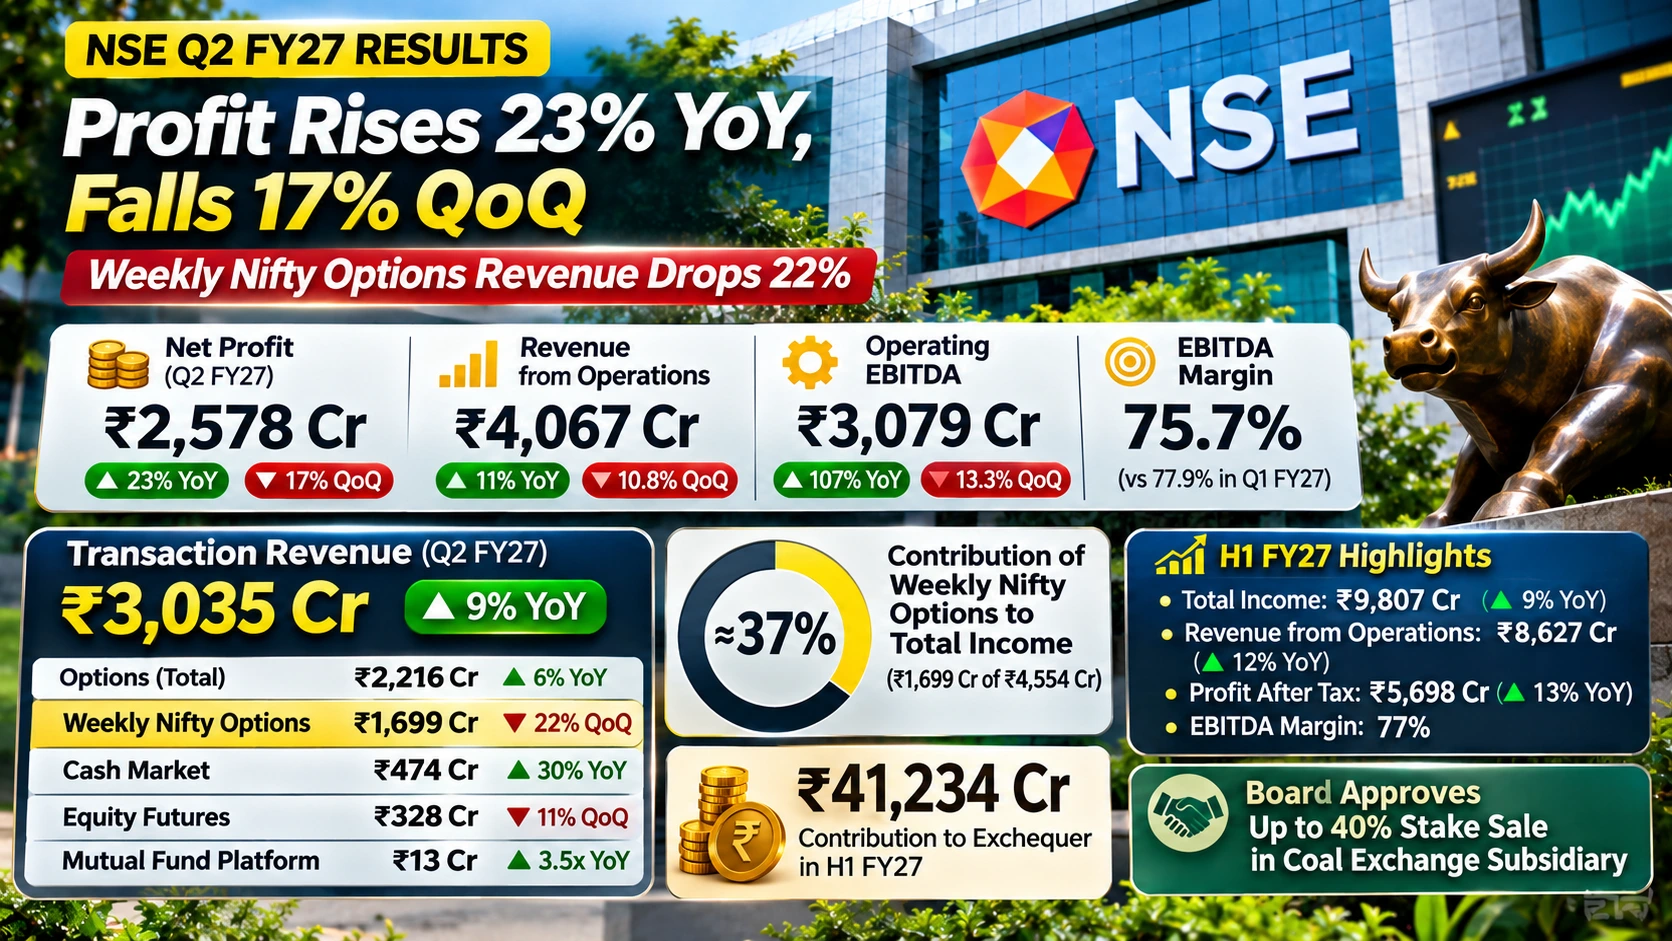
NSE Q2 FY27 RESULTS
The 107% YoY rise in EBITDA is partly due to a high base in Q2 FY26, which included a ₹1,297 crore provision for SEBI settlement fees related to co-location and dark-fibre matters.
Weekly Nifty Options Revenue Falls 22% QoQ
Transaction charges remained NSE’s largest revenue contributor, but the segment weakened compared with Q1 FY27.
NSE generated ₹3,035 crore in transaction-charge revenue during Q2 FY27, up 9% YoY from ₹2,789 crore. However, this was down around 16% from ₹3,623 crore in the preceding quarter.
The options segment generated ₹2,216 crore in transaction charges, an increase of 6% YoY. Within this category, weekly Nifty index options contributed ₹1,699 crore, compared with ₹2,170 crore in Q1 FY27, marking a 22% sequential decline.
NSE’s management described the weekly-options contribution as 38% of total income. Using the rounded disclosed figures of ₹1,699 crore and ₹4,554 crore, the calculated share is approximately 37.3%.
The other transaction segments also showed a mixed trend. Cash-market transaction charges increased 30% YoY to ₹474 crore but declined 6% QoQ. Transaction charges from equity futures stood at ₹328 crore, down 11% sequentially. Revenue from other index options and the NSE International Exchange also declined 22% QoQ to ₹185 crore.
These figures highlight the importance of derivatives activity to NSE’s revenue. A decline in weekly-options income can affect the exchange’s overall transaction revenue even when annual cash-market activity remains higher.
Track Live: Nifty Option Chain Live — OI, IV & LTP by Strike
Trading Volumes: Cash Market Grows 24% YoY
NSE’s trading-volume data showed different trends across market segments.
Average daily traded volume (ADTV) in the cash market increased 24% YoY to ₹1,18,377 crore during Q2 FY27. In equity options, ADTV measured by premium value rose 3% to ₹47,977 crore. Equity-futures ADTV stood at ₹1,24,574 crore.
The exchange reported market shares of approximately 92% in equity cash, 99.8% in equity futures and 68% in equity options. Management said the effective equity-options market share was close to 70% after adjusting for the impact of expiry-day holidays.
The sequential decline in trading activity was also discussed during the earnings call. The introduction of the Closing Auction Session (CAS) framework in August was an important market development during the quarter. Market and analyst commentary indicated that activity moderated across several segments after the change.
However, the CAS framework should not be treated as the sole proven cause of the decline in NSE’s earnings. Lower transaction charges, the mix of products traded and reduced investment income also affected the quarter.
Listing, Data and Mutual-Fund Businesses Add Revenue Support
NSE’s results also showed growth in businesses beyond transaction charges.
Listing-services revenue increased 70% YoY to ₹150 crore from ₹88 crore in Q2 FY26. Revenue from data feed and terminal services rose 43% to ₹165 crore from ₹115 crore. Data-connectivity charges contributed ₹267 crore during the quarter, while operating investment income increased 9% to ₹237 crore from ₹217 crore.
The mutual-fund platform also recorded strong growth. Transaction-charge revenue from this segment increased 3.5 times to ₹13 crore from ₹4 crore in the year-ago quarter.
According to NSE’s earnings discussion, mutual-fund platform orders increased 155% YoY to 6.72 crore in Q2 FY27 from 2.64 crore. Its market share by mutual-fund orders rose to around 22% from 12% in Q2 FY26.
These businesses are important because they broaden the exchange’s revenue sources. However, transaction charges still account for around 75% of NSE’s operating revenue, making trading activity a major earnings variable.
Why NSE’s EBITDA Increased 107% YoY
NSE’s consolidated operating EBITDA increased 107% YoY to ₹3,079 crore in Q2 FY27. Its EBITDA margin stood at 75.7%, compared with around 40% in Q2 FY26.
The sharp annual increase needs to be read alongside the previous year’s expense base. NSE had recognised a ₹1,297-crore provision in Q2 FY26 towards SEBI settlement fees relating to colocation and dark-fibre matters.
As a result, consolidated expenditure in the year-ago quarter was ₹2,354 crore, compared with ₹1,161 crore in Q2 FY27. The lower comparison base contributed significantly to the reported EBITDA growth.
Management also discussed the impact of one-off items on the comparison. The CFO said profit before tax from continuing operations increased 13% YoY, while growth was 9% after normalising for one-offs in the corresponding period of the previous financial year.
Therefore, the reported 107% EBITDA increase should not be treated as the normal recurring growth rate of NSE’s business. The sequential fall in EBITDA to ₹3,079 crore from ₹3,551 crore is also relevant when assessing the latest operating trend.
H1 FY27 Results: Consolidated Profit Reaches ₹5,698 Crore
For the first half of FY27, NSE reported consolidated total income of ₹9,807 crore, up 9% YoY. Revenue from operations increased 12% to ₹8,627 crore.
Operating EBITDA rose 45% to ₹6,674 crore, with a margin of 77%. Consolidated PAT increased 13% to ₹5,698 crore from ₹5,022 crore in H1 FY26. Non-annualised earnings per share stood at ₹23.02.
On a standalone basis, Q2 FY27 total income increased 8% YoY to ₹3,956 crore, while revenue from operations rose 9% to ₹3,567 crore. Standalone EBITDA stood at ₹2,622 crore, with a 74% margin, and PAT increased 16% to ₹2,164 crore.
For H1 FY27, standalone total income reached ₹8,568 crore. Standalone EBITDA increased 51% to ₹5,726 crore, while PAT rose 12% to ₹4,798 crore.
NSE Contributes ₹41,234 Crore to the Exchequer in H1
NSE reported a contribution of ₹41,234 crore to the exchequer during the first half of FY27. This included securities transaction tax and commodities transaction tax (STT/CTT), income tax, stamp duty, GST and SEBI fees.
| H1 FY27 contribution | Amount |
|---|---|
| STT/CTT | ₹34,788 crore |
| Income tax | ₹2,885 crore |
| Stamp duty | ₹1,926 crore |
| GST | ₹1,171 crore |
| SEBI fees | ₹464 crore |
| Total | ₹41,234 crore |
STT/CTT represented the largest component. Within this collection, equity derivatives contributed 55%, cash-market delivery transactions 38% and cash-market intraday transactions 7%.
These amounts represent contributions to government collections, not revenue earned by NSE. The high share of derivatives in STT/CTT collections also reflects the importance of the segment in India’s exchange-traded markets.
Tokenised Bonds and New Products Expand NSE’s Market Activities
NSE also highlighted developments in its market-infrastructure business during the quarter.
The exchange facilitated India’s first tokenised bond issuances, aggregating ₹1,000 crore. The issuers were REC Limited and Larsen & Toubro, with each raising ₹500 crore through the platform.
NSE also highlighted initiatives involving derivatives on the Nifty India FPI 150 Index and Corporate Bond Index Futures. These developments indicate an effort to expand the exchange’s product range beyond conventional equity trading.
The future financial contribution of these products will depend on issuer participation, investor adoption and trading activity.
NSE Approves Up to 40% Stake Sale in Coal Exchange Subsidiary
Alongside the Q2 results, NSE’s board approved the divestment of up to 40% of its stake in National Coal Exchange of India Limited, a wholly owned subsidiary.
The proposed transaction will involve a secondary sale of existing equity shares in one or more tranches. This means NSE proposes to sell part of its existing holding; it is not a fresh issue of shares by the subsidiary to raise new capital.
The exchange has not disclosed the buyer, valuation, timing or final transaction terms. Further disclosures are expected once the terms are finalised or a relevant disclosure event occurs.
The proposed sale is therefore a corporate development to monitor, not a completed transaction or confirmed source of proceeds.
What Investors Should Watch After NSE Q2 Results
NSE’s Q2 FY27 performance presents two different signals. Annual profit increased 23%, cash-market transaction charges rose 30% and listing and data-related businesses recorded growth. However, consolidated PAT declined 17.4% sequentially, while transaction-charge revenue fell 16% from Q1 FY27.
The key indicators for Q3 FY27 will be the recovery or stability of weekly-options activity, cash-market volumes, transaction revenue and investment income. Investors will also watch the effect of the revised CAS framework, growth in non-transaction businesses and updates on the coal-exchange stake sale.
For NSE, the central question is whether its market leadership can translate into steadier sequential earnings while the exchange broadens its revenue base beyond derivatives-linked transaction charges.
Read Next: RBI VRRR Bids Jump to ₹73,907 Crore; Announces Second ₹25,000-Crore Auction
Disclaimer: This article is for informational and educational purposes only and does not constitute investment advice or a recommendation to buy or sell any security. Readers should verify company disclosures and consult a SEBI-registered investment adviser before making investment decisions.