
Apollo Hospitals Q2 FY27 Scheduled for November 4
Apollo Hospitals Enterprise is preparing to announce its Q2 FY27 financial results on Wednesday, November 4, 2026. Investors will closely track the September-quarter performance to determine whether the healthcare major can maintain its strong earnings momentum.
The company has also scheduled its analyst and investor conference call for Thursday, November 5, at 3:00 PM IST.
With healthcare demand, hospital expansion and digital pharmacy operations attracting investor attention, the upcoming Apollo Hospitals Q2 results could become an important trigger for the stock.
The market will particularly watch whether revenue growth translates into stronger profitability and improved operating margins.
Track Live : Results Calendar — NSE & BSE
Apollo Hospitals Q2 FY27 results schedule
| Event | Date | Time (IST) | Details |
|---|---|---|---|
| Board meeting | 4 November 2026 | Not announced | Consider and approve Q2 and H1 FY27 unaudited financial results |
| Results announcement | 4 November 2026 | Not announced | September-quarter financial performance |
| Earnings conference call | 5 November 2026 | 3:00 PM | Discussion with analysts and investors |
| Earnings presentation | 5 November 2026 | Around the call | Financial and operational performance |
The board meeting date is supported by the company’s exchange filing information. The conference-call schedule is reported in the company’s investor-event disclosures.
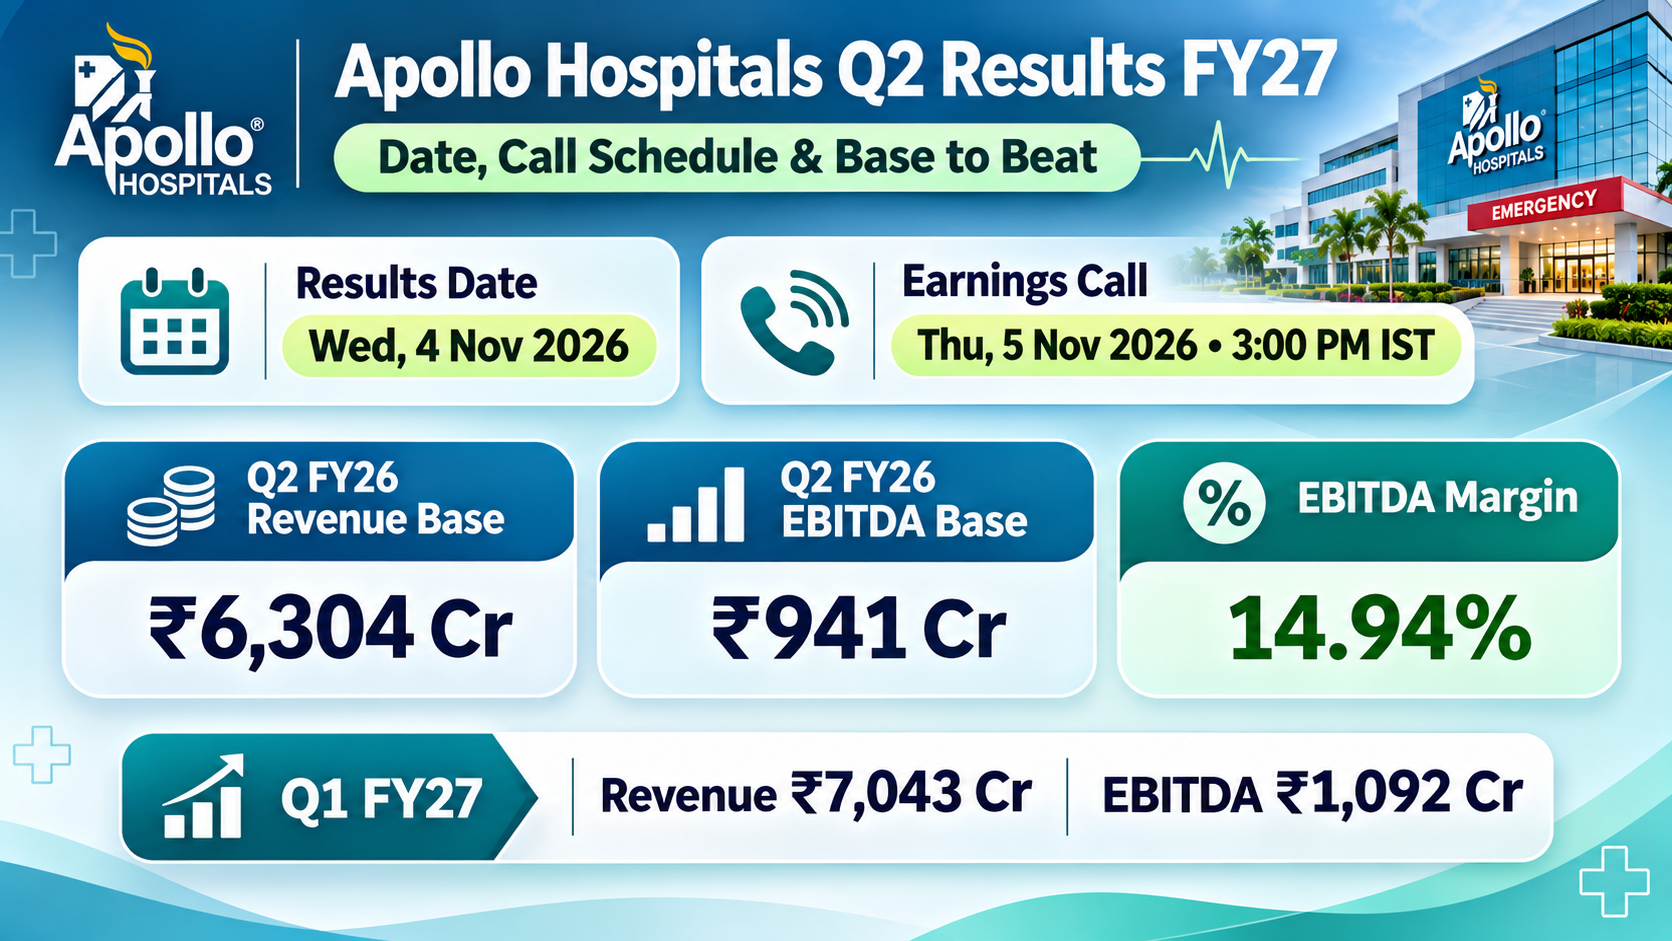
Apollo Hospitals Q2 FY27 Revenue and EBITDA: What Is the Base to Beat?
Investors will compare the September-quarter performance with the corresponding quarter of the previous financial year.
Apollo Hospitals reported revenue of ₹6,304 crore and EBITDA of ₹941 crore in Q2 FY26, translating into an EBITDA margin of approximately 14.94%.
The latest available quarterly performance provides another important benchmark.
In Q1 FY27, Apollo Hospitals reported revenue of ₹7,043 crore, marking 21% year-on-year growth. EBITDA increased 28% to ₹1,092 crore.
The following figures will be important when the company announces its Q2 FY27 results:
| Financial indicator | Q2 FY26 actual | YoY growth |
|---|---|---|
| Consolidated revenue | ₹6,304 crore | 13% |
| Consolidated EBITDA | ₹941 crore | 15% |
| EBITDA margin | 14.94% | — |
| Consolidated PAT | ₹477 crore | 26% |
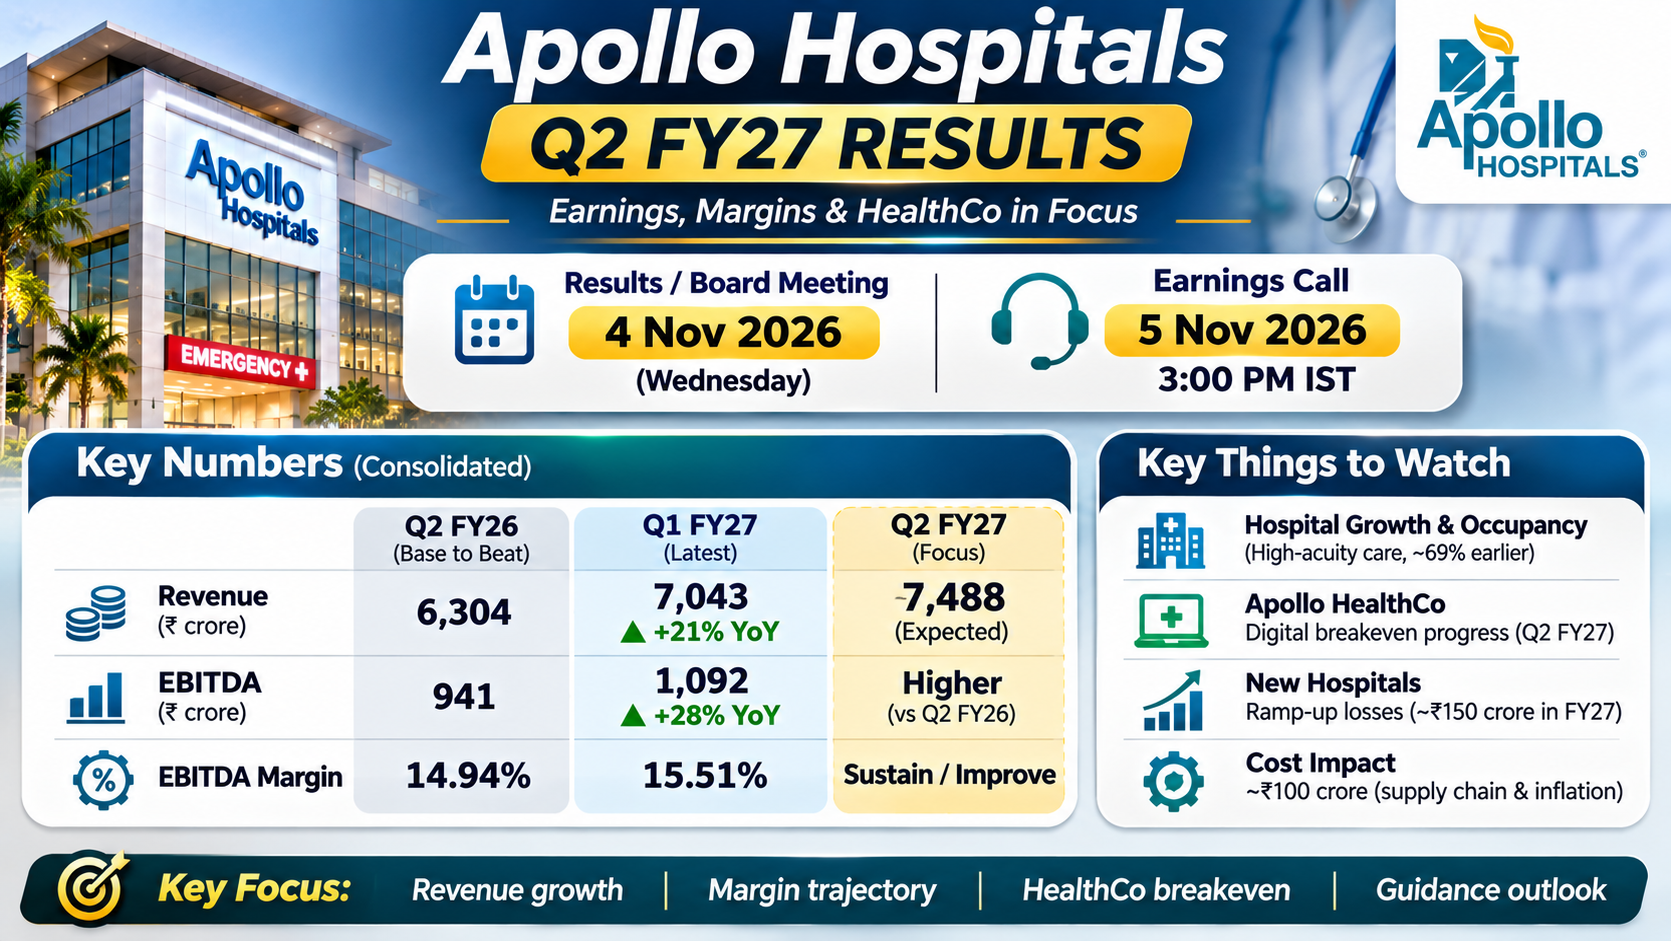
The supplied information does not establish a verified analyst consensus for Q2 FY27. Therefore, investors should treat the projected revenue of approximately ₹7,488 crore as a market-tracking reference rather than a confirmed brokerage consensus.
Q1 FY27 performance: Latest quarterly benchmark
Apollo Hospitals delivered strong growth in the June 2026 quarter, providing a reference point for Q2 expectations.
| Financial indicator | Q1 FY27 | YoY growth |
|---|---|---|
| Consolidated revenue | ₹7,043 crore | 21% |
| EBITDA | ₹1,092 crore | 28% |
| Consolidated PAT | ₹581 crore | 34% |
| Hospital revenue | ₹3,567 crore | 22% |
| HealthCo revenue | ₹2,977 crore | 20% |
| HealthCo EBITDA | ₹171 crore | — |
Track Live : NSE Option Chain — Live | BSE Option Chain — Live Sensex & Bankex Options Data Today
Hospital Growth and Apollo HealthCo Breakeven Remain Key Triggers
Beyond consolidated revenue, investors will closely monitor Apollo Hospitals’ individual business segments.
The hospital business remains a major growth driver, supported by increasing demand for specialised healthcare services.
High-acuity specialties, including complex and advanced treatments, have been particularly important. The supplied operating data indicates 24% growth in these specialties, accounting for approximately 62% of inpatient revenue.
However, expansion costs could influence profitability.
Management had indicated that new hospital ramp-up losses could reach approximately ₹150 crore for FY27, with facilities in Bengaluru and Gurgaon gradually scaling up.
Investors will also monitor the anticipated ₹100 crore cost impact associated with regional supply-chain and inflationary pressures.
Another major development is Apollo HealthCo. Its online digital business was targeting breakeven around Q2 FY27 after reducing digital cash losses to approximately ₹10 crore in Q1 FY27.
The September-quarter results could provide important clues about whether this target remains achievable.
Track Live : Nifty Levels Today | Sensex Levels Today
Key factors that could influence Q2 FY27 results
| Key factor | Important details |
|---|---|
| Revenue growth | Investors will monitor whether revenue growth remains close to 20% |
| EBITDA performance | Q2 FY26 base was ₹941 crore |
| EBITDA margins | Previous-year margin was 14.94% |
| High-acuity specialties | CoNGOTE specialties grew 24% in Q1 and contributed approximately 62% of inpatient revenue |
| Hospital occupancy | Q1 FY27 occupancy stood at 70% |
| Digital business | Apollo 24/7 digital business targeted breakeven in the upcoming quarter |
| New hospital losses | FY27 EBITDA loss guidance of approximately ₹150 crore |
| Hospital expansion | More than 5,800 additional beds planned over five years |
| HealthCo demerger | Progress towards the proposed demerger and listing roadmap |
| Cost pressures | Investors will monitor inflation and operating costs |
New hospital expansion and profitability
Apollo is expanding its hospital network, but newly commissioned facilities could put pressure on near-term profitability.
| Expansion indicator | Details |
|---|---|
| FY27 new-hospital EBITDA loss guidance | Approximately ₹150 crore |
| Sarjapur hospital | Launched in Q1 FY27 |
| Gurugram facility | Commissioning expected in Q3 FY27 |
| Five-year bed expansion plan | More than 5,800 beds |
| Established hospital revenue growth guidance | 13–14% |
| Overall hospital revenue growth guidance | 20% for FY27 |
The important question is whether existing hospitals can maintain healthy profitability while new facilities gradually increase occupancy and operational efficiency.
Why do two PAT figures circulate?
Use these figures consistently when preparing the article:
| Reporting period | Official reported consolidated PAT |
|---|---|
| Q2 FY26 | ₹477 crore |
| Q1 FY27 | ₹581 crore |
The ₹477 crore figure is the correct Q2 FY26 comparison base, while ₹581 crore is the latest Q1 FY27 reported PAT. Do not mix these with alternative adjusted-profit or attributable-profit figures without checking their definitions against the financial statements.
Apollo Hospitals’ previous results announcement dates
| Quarter | Board meeting / results date |
|---|---|
| Q1 FY27 | 12 August 2026 |
| Q4 FY26 | 20 May 2026 |
| Q3 FY26 | 10 February 2026 |
| Q2 FY26 | 6 November 2025 |
| Q1 FY26 | 12 August 2025 |
| Q4 FY25 | 30 May 2025 |
| Q3 FY25 | 10 February 2025 |
Here’s What Happened Today and Why Traders Reacted
The upcoming results have placed Apollo Hospitals shares on investors’ watchlists ahead of the November 4 announcement.
The key factors influencing trading sentiment include:
-
Revenue growth: Whether quarterly revenue moves closer to the ₹7,488 crore tracking benchmark.
-
EBITDA margins: Whether operating profitability improves from the previous year’s 14.94% margin.
-
Hospital expansion: Whether new facilities are scaling up without significantly increasing losses.
-
Digital business: Whether Apollo HealthCo moves closer to its targeted breakeven.
-
Management guidance: Whether the hospital revenue growth outlook of approximately 20% is maintained.
These developments could influence short-term trading activity and institutional investor expectations.
Read More : Indian Stock Market Rise: Why Foreign Investors Are Back With $2.28 Billion
What Impact Could Apollo Hospitals Q2 Results Have on Investors?
The Apollo Hospitals Q2 FY27 results could determine the stock’s near-term direction.
Better-than-expected revenue growth, improving EBITDA margins and progress towards HealthCo breakeven could support positive investor sentiment.
However, higher expansion costs, inflationary pressures or weaker-than-expected margins could create selling pressure.
Long-term investors should focus on hospital occupancy, profitability, new-bed utilisation and digital business performance rather than revenue growth alone.
One important point is the profit discrepancy appearing in different market reports. Figures of ₹477.2 crore and ₹581 crore, as well as ₹494 crore and ₹610 crore, have been circulated. Investors should verify whether these represent standalone or consolidated results and reported versus adjusted profit before comparing them.
What investors should watch on November 4
| Indicator | Positive signal |
|---|---|
| Revenue | Growth approaching or exceeding 20% |
| EBITDA | Exceeding ₹1,120 crore indicative estimate |
| EBITDA margin | Maintaining approximately 15% |
| PAT | Sustaining strong year-on-year growth |
| Hospital occupancy | Improving from the previous 70% level |
| Digital business | Progress towards breakeven |
| Management guidance | Maintaining 20% hospital revenue growth target |
These are monitoring benchmarks, not guaranteed share-price triggers.