Nifty 50 rose 149.75 points, or 0.63%, to close at 23,960.60 on November 4. NiftyTrader’s F&O data showed 117 validated long build-up signals, against 23 short build-ups and 23 short-covering stocks after excluding Vodafone Idea and four index records. GMRAIRPORT led the long list by Spurt Score, while MCX topped the short build-up list.
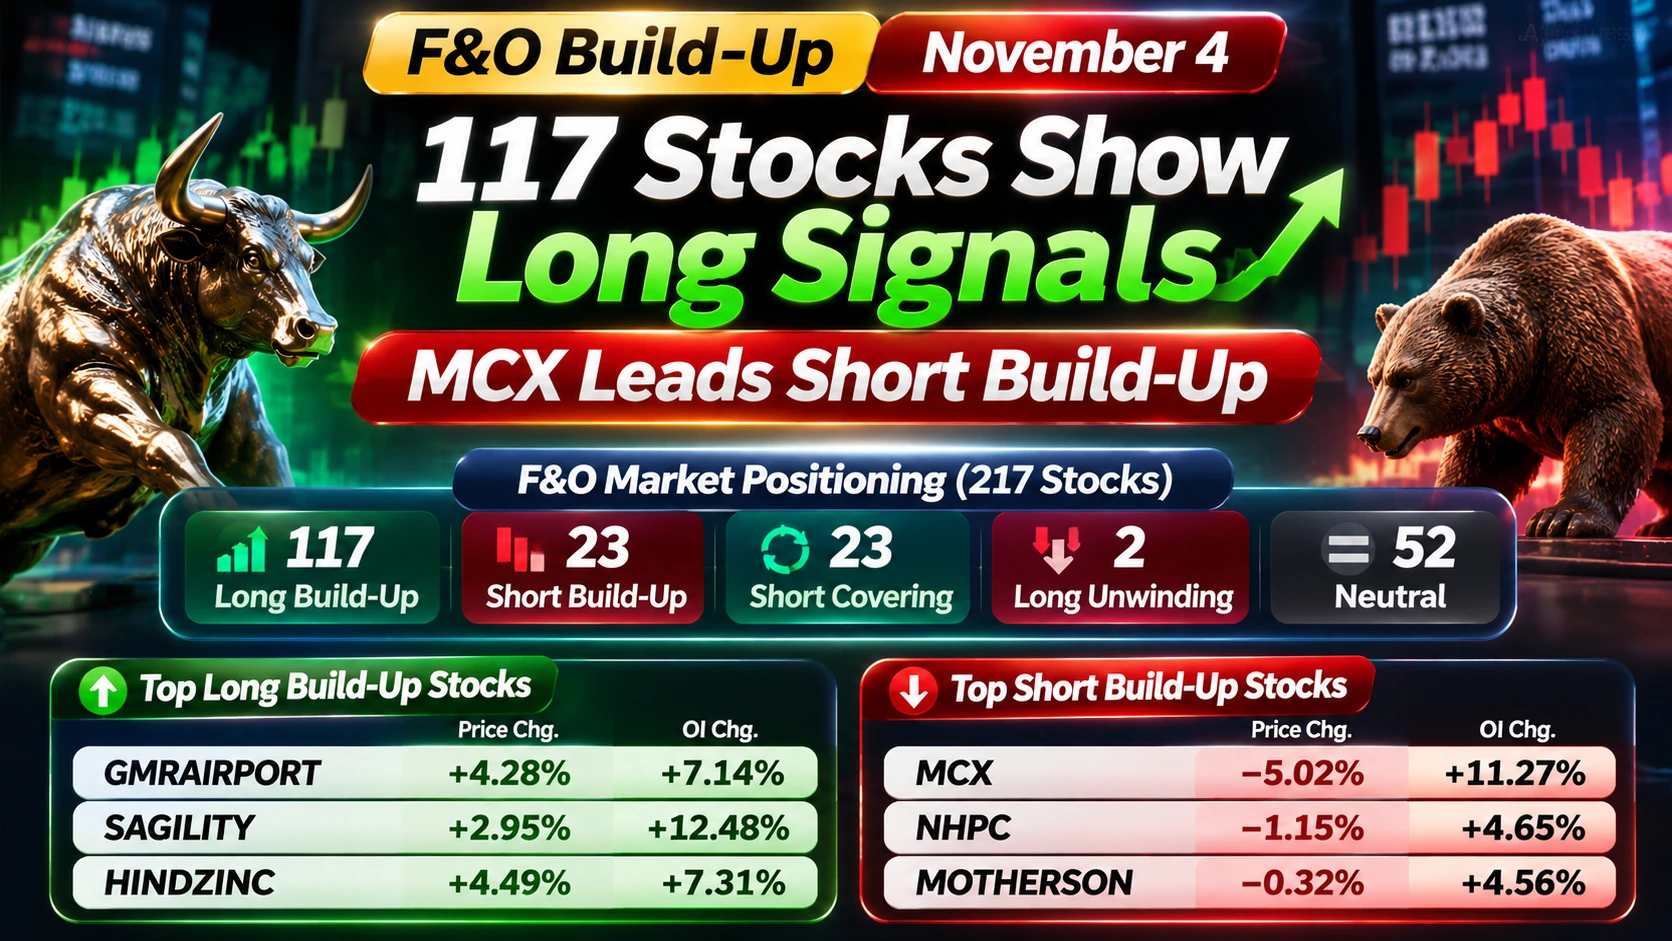
F&O Market Positioning on November 4
The November 4 F&O data showed a broader concentration of long build-up signals across the tracked stocks. However, selective bearish positioning remained visible in stocks such as MCX, NHPC and MOTHERSON.
After excluding four index records and Vodafone Idea (IDEA), whose reported OI figures did not reconcile with NSE data, the validated distribution covered 217 individual F&O stocks.
| F&O Signal | Number of Stocks |
|---|---|
| Long Build-Up | 117 |
| Short Build-Up | 23 |
| Short Covering | 23 |
| Long Unwinding | 2 |
| Neutral | 52 |
| Total | 217 |
Long build-up represented approximately 53.9% of the validated stock universe, making it the largest positioning category.
The four classifications are based on the relationship between price movement and open interest:
- Long Build-Up: Price increases and OI increases, indicating fresh positioning alongside rising prices.
- Short Build-Up: Price declines and OI increases, indicating fresh short positioning.
- Short Covering: Price increases and OI declines, indicating a reduction in existing open positions consistent with short covering.
- Long Unwinding: Price declines and OI declines, indicating a reduction in existing long positions.
Track Live: NiftyTrader OI Spurts · NiftyTrader Nifty PCR · NiftyTrader NSE Option Chain
Top 10 Stocks in Long Build-Up
Long build-up occurs when a stock’s price and open interest increase together. This pattern generally indicates fresh positioning alongside upward price movement.
The following stocks featured among the leading long build-up counters on November 4, ranked by NiftyTrader’s Spurt Score.
| Stock | NiftyTrader LTP (₹) | Price Change | OI Change | Spurt Score |
|---|---|---|---|---|
| GMRAIRPORT | 95.00 | +4.28% | +7.14% | 93.82 |
| SAGILITY | 43.59 | +2.95% | +12.48% | 91.52 |
| HINDZINC | 550.15 | +4.49% | +7.31% | 84.42 |
| LTF | 263.70 | +4.39% | +3.80% | 82.21 |
| JIOFIN | 222.27 | +3.73% | +2.36% | 80.09 |
| KALYANKJIL | 529.05 | +4.10% | +4.41% | 77.51 |
| JINDALSTEL | 1,149.00 | +3.98% | +6.61% | 76.77 |
| BAJFINANCE | 994.00 | +2.47% | +3.63% | 76.13 |
| RBLBANK | 364.75 | +4.15% | +2.49% | 75.58 |
| HDFCBANK | 736.70 | +1.54% | +2.94% | 75.30 |
GMRAIRPORT recorded the highest Spurt Score of 93.82, followed by SAGILITY at 91.52 and Hindustan Zinc at 84.42.
SAGILITY recorded a 12.48% increase in OI, the highest among these ten stocks. Hindustan Zinc and GMRAIRPORT also witnessed simultaneous increases in price and open interest.
The combination of rising prices and additional open positions makes these stocks important to monitor for continuation of the existing trend.
However, a long build-up signal alone does not confirm that the upward movement will continue in the next trading session.
Top 10 Stocks in Short Build-Up
Short build-up occurs when a stock’s price declines while open interest increases. This pattern is generally associated with fresh bearish positioning.
MCX, NHPC and MOTHERSON featured among the leading stocks in this category.
| Stock | NiftyTrader LTP (₹) | Price Change | OI Change | Spurt Score |
|---|---|---|---|---|
| MCX | 3,315.00 | -5.02% | +11.27% | 78.16 |
| NHPC | 78.49 | -1.15% | +4.65% | 77.33 |
| MOTHERSON | 159.49 | -0.32% | +4.56% | 73.00 |
| ZYDUSLIFE | 1,188.10 | -4.23% | +3.64% | 72.81 |
| MAHABANK | 79.61 | -1.23% | +4.75% | 68.94 |
| BSE | 3,601.50 | -1.75% | +8.06% | 67.47 |
| TCS | 2,436.00 | -2.52% | +3.31% | 65.81 |
| INFY | 1,128.20 | -1.73% | +1.23% | 56.77 |
| ABCAPITAL | 379.95 | -0.28% | +2.88% | 54.47 |
| UJJIVANSFB | 56.70 | -0.18% | +2.07% | 53.09 |
MCX recorded the highest Spurt Score in the short build-up category at 78.16. Its price declined 5.02%, while open interest increased 11.27%.
BSE also witnessed a notable increase in open interest of 8.06%, accompanied by a 1.75% decline in its reported price.
ZYDUSLIFE declined 4.23%, with OI increasing 3.64%. TCS and INFY also featured in the short build-up list, indicating bearish positioning in selected technology stocks.
These counters may remain on traders’ watchlists to assess whether selling pressure and additional OI creation continue.
Top 10 Stocks in Short Covering
Short covering occurs when prices rise while open interest declines. This indicates a reduction in existing positions and is generally associated with traders exiting bearish bets.
The following stocks featured among the leading short-covering counters.
| Stock | NiftyTrader LTP (₹) | Price Change | OI Change | Spurt Score |
|---|---|---|---|---|
| BHEL | 423.85 | +5.96% | -2.88% | 82.21 |
| IREDA | 106.00 | +3.62% | -4.10% | 80.83 |
| PFC | 322.50 | +1.42% | -3.14% | 74.10 |
| MANAPPURAM | 314.20 | +3.13% | -1.96% | 69.40 |
| ICICILIFE | 423.05 | +3.26% | -2.64% | 65.16 |
| AUBANK | 904.35 | +2.77% | -2.22% | 61.38 |
| BIOCON | 344.45 | +0.42% | -2.21% | 59.45 |
| PATANJALI | 383.90 | +2.40% | -1.76% | 58.71 |
| BPCL | 304.70 | +2.63% | -1.58% | 57.70 |
| DABUR | 395.00 | +3.50% | -1.07% | 56.04 |
BHEL gained 5.96% while its open interest declined 2.88%. IREDA advanced 3.62%, accompanied by a 4.10% reduction in OI.
PFC also recorded short covering, with its price gaining 1.42% while open interest declined 3.14%.
These movements suggest that existing positions were being reduced as prices advanced. However, short covering should not automatically be interpreted as fresh long buying.
Traders will need to watch whether these stocks witness additional OI creation alongside further price increases to identify a possible shift towards fresh long positions.
Stocks Witnessing Long Unwinding
Long unwinding occurs when both price and open interest decline, indicating that traders are reducing existing long positions.
Only two stocks featured in this category on November 4.
| Stock | NiftyTrader LTP (₹) | Price Change | OI Change | Spurt Score |
|---|---|---|---|---|
| KOTAKBANK | 459.40 | -1.13% | -0.96% | 55.21 |
| ALKEM | 5,216.50 | -0.37% | -1.14% | 18.99 |
KOTAKBANK declined 1.13% while open interest decreased 0.96%. ALKEM also witnessed a marginal decline in both price and OI.
The limited number of stocks in this category indicates that long unwinding was not widespread among the validated stocks tracked in the report.
What Should F&O Traders Watch Next?
The November 4 positioning data highlights three developments that traders can monitor in the next session.
1. Continuation of long build-up: With 117 validated stocks in the long build-up category, bullish positioning was more widespread than fresh short positioning. GMRAIRPORT, SAGILITY and Hindustan Zinc are among the counters to monitor for further price gains accompanied by OI addition.
2. Selective bearish positioning: MCX, NHPC, MOTHERSON, ZYDUSLIFE and BSE witnessed short build-up signals. Continued price weakness alongside rising OI would reinforce these bearish positioning patterns.
3. Short covering in selected stocks: BHEL, IREDA and PFC witnessed price gains alongside declining OI. Traders should watch whether fresh long positions emerge in subsequent sessions rather than treating short covering alone as a bullish confirmation.
Market Takeaway
The November 4 F&O data showed a clear numerical dominance of long build-up signals, with 117 stocks in this category against 23 stocks witnessing short build-up.
GMRAIRPORT, SAGILITY and Hindustan Zinc featured among the leading long build-up stocks by Spurt Score, while MCX, NHPC and MOTHERSON remained among the prominent short build-up counters.
Short covering in BHEL, IREDA and PFC also indicated a reduction in existing open positions.
For traders, the next session’s price action and changes in open interest will be important in determining whether these positioning patterns strengthen or reverse. Fresh OI addition alongside rising prices would support a continuation of long build-up, while falling prices with increasing OI could indicate further bearish positioning.
Read Next: NSE Q2 FY27 Profit Rises 23% YoY, Falls 17% QoQ; Weekly Nifty Options Revenue Drops 22%
Data and Methodology
This report is based on NiftyTrader’s November 4, 2026 OI Spurts export, cross-checked against NSE’s end-of-day F&O Bhavcopy.
The original export contained 222 records, comprising 218 individual stock records and four index records: NIFTY, BANKNIFTY, FINNIFTY and MIDCPNIFTY.
After removing the four index records and excluding Vodafone Idea (IDEA) because of a material discrepancy in its reported OI, the validated stock distribution covered 217 stocks.
Current futures OI was reconciled against NSE’s aggregate futures open interest across the November 23, December 29, 2026 and January 25, 2027 expiries. The current OI for these 217 stocks was within 0.5% of the NSE aggregate comparison.
One additional data limitation was identified in PGEL. Its current OI was within the reconciliation tolerance, but the CSV reported an OI change of +1,900, compared with -5,700 in the NSE Bhavcopy aggregate. PGEL remained classified as Neutral in the NiftyTrader export, so this discrepancy did not alter the reported category distribution.
Stock-level classifications use NiftyTrader’s reported underlying-stock price changes and futures OI changes. The LTP figures are reproduced from the NiftyTrader export and have not been independently certified as official NSE cash-market closing prices. The export does not contain an extraction timestamp.
The tables are ranked by NiftyTrader’s Spurt Score within each category. All OI-based classifications are indicative positioning signals and should not be interpreted as confirmation of individual traders’ actions or predictions of future price direction.
Sources: NiftyTrader OI Spurts · NiftyTrader Nifty PCR · NiftyTrader NSE Option Chain · NSE F&O Reports and Bhavcopy · NSE Contract Specifications · NSE Trading Holidays.
Disclaimer: This report is for informational and educational purposes only and should not be considered investment or trading advice. F&O build-up signals are indicative of market positioning and do not guarantee future price movements. Verify data independently and consult a SEBI-registered investment adviser before making trading decisions.