
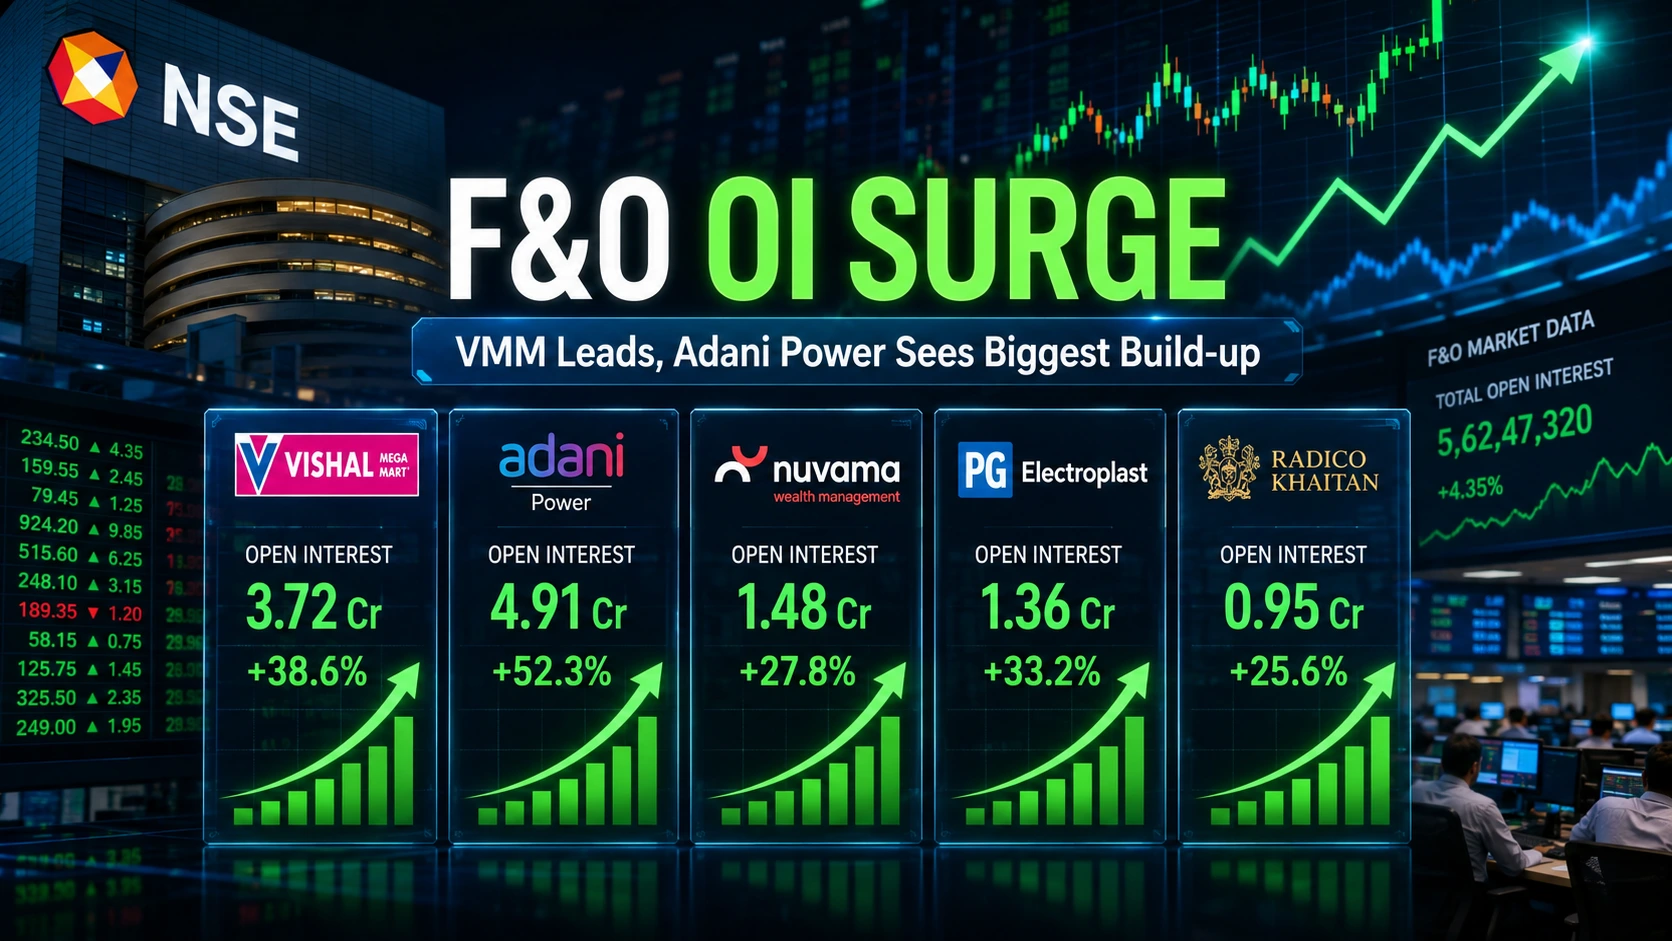
Five NSE F&O stocks saw futures open interest rise more than 6% on June 16, led by Vishal Mega Mart on percentage terms and Adani Power on absolute OI addition. The data signals fresh position build-up, but traders should confirm the direction with price movement before reading it as bullish or bearish.
Key Takeaways
- Vishal Mega Mart recorded the sharpest futures OI rise at 13.75%.
- Adani Power saw the biggest absolute addition, with OI rising by 88,25,300.
- Nuvama Wealth Management, PG Electroplast and Radico Khaitan also saw futures OI rise more than 6%.
- Rising OI confirms fresh positioning, but not the trade direction by itself.
- Traders should check price movement, volume, futures premium/discount and option-chain data before taking a view.
F&O stocks with sharp rise in futures open interest
Futures open interest is one of the most tracked data points in the derivatives market. It shows the total number of outstanding positions that remain open at the end of a trading session.
When open interest rises sharply, it usually means traders are adding new positions or increasing existing ones. But OI alone does not say whether the market is bullish or bearish. That depends on how the stock price moved along with OI.
On June 16, five stocks in the NSE F&O segment recorded more than a 6% rise in futures OI.
| Stock | Futures OI | Change in OI | Change in OI % | Key signal |
|---|---|---|---|---|
| Vishal Mega Mart | 2,68,050 | 32,400 | 13.75% | Highest percentage OI rise |
| Nuvama Wealth Management | 18,70,500 | 1,42,500 | 8.25% | Fresh positioning in capital-market stock |
| Adani Power | 12,62,55,750 | 88,25,300 | 7.52% | Highest absolute OI addition |
| PG Electroplast | 1,59,09,650 | 10,90,600 | 7.36% | Build-up in EMS stock |
| Radico Khaitan | 3,85,72,050 | 24,00,750 | 6.64% | OI expansion in consumption stock |
Source: NSE/NiftyTrader F&O data, June 16, 2026.
Vishal Mega Mart leads on percentage terms
Vishal Mega Mart saw the sharpest percentage increase in futures OI. Its OI rose 13.75% to 2,68,050, with an addition of 32,400.
This makes the stock the top OI gainer among the five names in percentage terms. However, traders should avoid reading the number in isolation. A higher OI base, price trend and intraday volume are all needed to understand whether the build-up is long-led or short-led.
Vishal Mega Mart is also a relatively new F&O counter. NSE introduced futures and options contracts on the stock from April 1, 2026. Newer F&O names can sometimes see sharper OI swings as liquidity builds and traders start tracking the counter more actively.
Adani Power records the biggest absolute OI addition
Adani Power was the most important stock in absolute terms. Its futures OI rose by 88,25,300 to 12,62,55,750, a 7.52% increase from the previous session.
This is a large addition and deserves attention because absolute OI build-up often matters more than percentage change in high-liquidity names. If the stock price also moved higher with this OI rise, it would suggest long build-up. If price declined while OI rose, it would point to short build-up.
Adani Power was also introduced into the F&O segment from April 1, 2026. The stock has remained active among derivative traders, helped by liquidity and recent stock-specific news flow. The company has also notified exchanges about nuclear-energy-linked subsidiaries, keeping it in focus for power-sector watchers.
Nuvama, PG Electroplast and Radico also see fresh build-up
Nuvama Wealth Management saw futures OI rise 8.25% to 18,70,500. The stock added 1,42,500 in OI during the session.
For a capital-market-linked name, traders should also watch broader market momentum because the stock can react to market activity, volumes and risk appetite.
PG Electroplast recorded a 7.36% OI increase, with total futures OI rising to 1,59,09,650.
The stock belongs to the electronics manufacturing services space, where price moves can be sharp because of earnings expectations, margin trends, raw-material costs and sector rotation.
Radico Khaitan saw futures OI rise 6.64% to 3,85,72,050.
The company remains part of the premium consumption theme, and recent broker commentary has focused on premiumisation-led growth.
For F&O traders, however, the immediate focus should remain on whether price action confirms the OI build-up.
How traders should read this OI data
A sharp rise in futures OI should be treated as a signal of participation, not a trading call. Traders should combine it with price movement.
| Price movement | OI movement | Possible interpretation |
|---|---|---|
| Price up | OI up | Long build-up |
| Price down | OI up | Short build-up |
| Price up | OI down | Short covering |
| Price down | OI down | Long unwinding |
This distinction is important. Two stocks can show the same OI rise, but the interpretation can be completely different if one closes higher and the other closes lower.
That is why traders should cross-check futures OI with spot price, futures premium or discount, traded volume and option-chain data.
Track live: Nifty Option Chain Live – OI, IV & Greeks
Why this matters for traders
A cluster of OI build-up in individual F&O stocks usually shows that traders are moving beyond index-only trades and building stock-specific positions.
This can happen because of earnings, sector rotation, corporate news, liquidity shifts or technical breakouts.
But higher OI also increases the risk of sharp unwinding. If traders who created fresh positions rush to exit, the same stock can move quickly in the opposite direction.
For this reason, OI gainers should be treated as a watchlist, not a recommendation list. The next session’s price action will decide whether this build-up continues or gets unwound.
Also Read: What Is Open Interest? OI Build-Up, Long Build-Up, Short Build-Up Explained
Bottom line
Vishal Mega Mart, Adani Power, Nuvama Wealth Management, PG Electroplast, and Radico Khaitan saw futures OI rise more than 6% on June 16. Vishal Mega Mart led on percentage change, while Adani Power recorded the biggest absolute OI addition.
The data points to fresh positioning, but not the direction of the trade by itself. Traders should confirm the signal with price trend, volume, and option-chain behaviour before acting on it.
Disclaimer: This article is for information and education only. It is not investment advice or a recommendation to buy, sell, or trade any stock or derivative contract. F&O trading carries significant risk. Securities market investments are subject to market risks. Read all related documents carefully before investing.