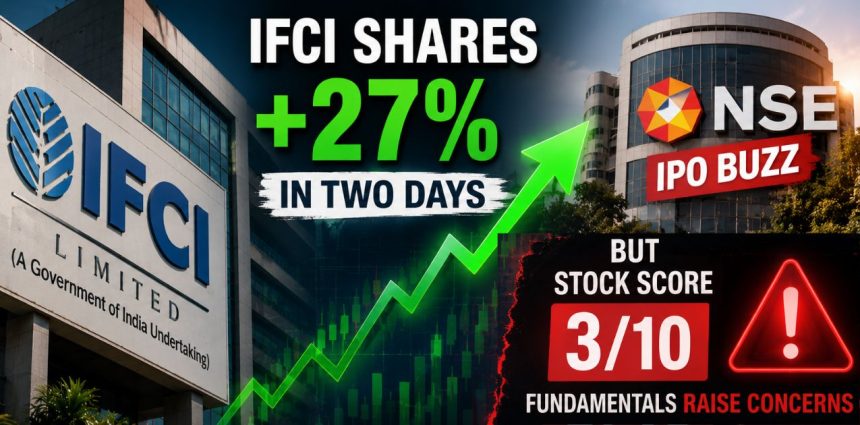
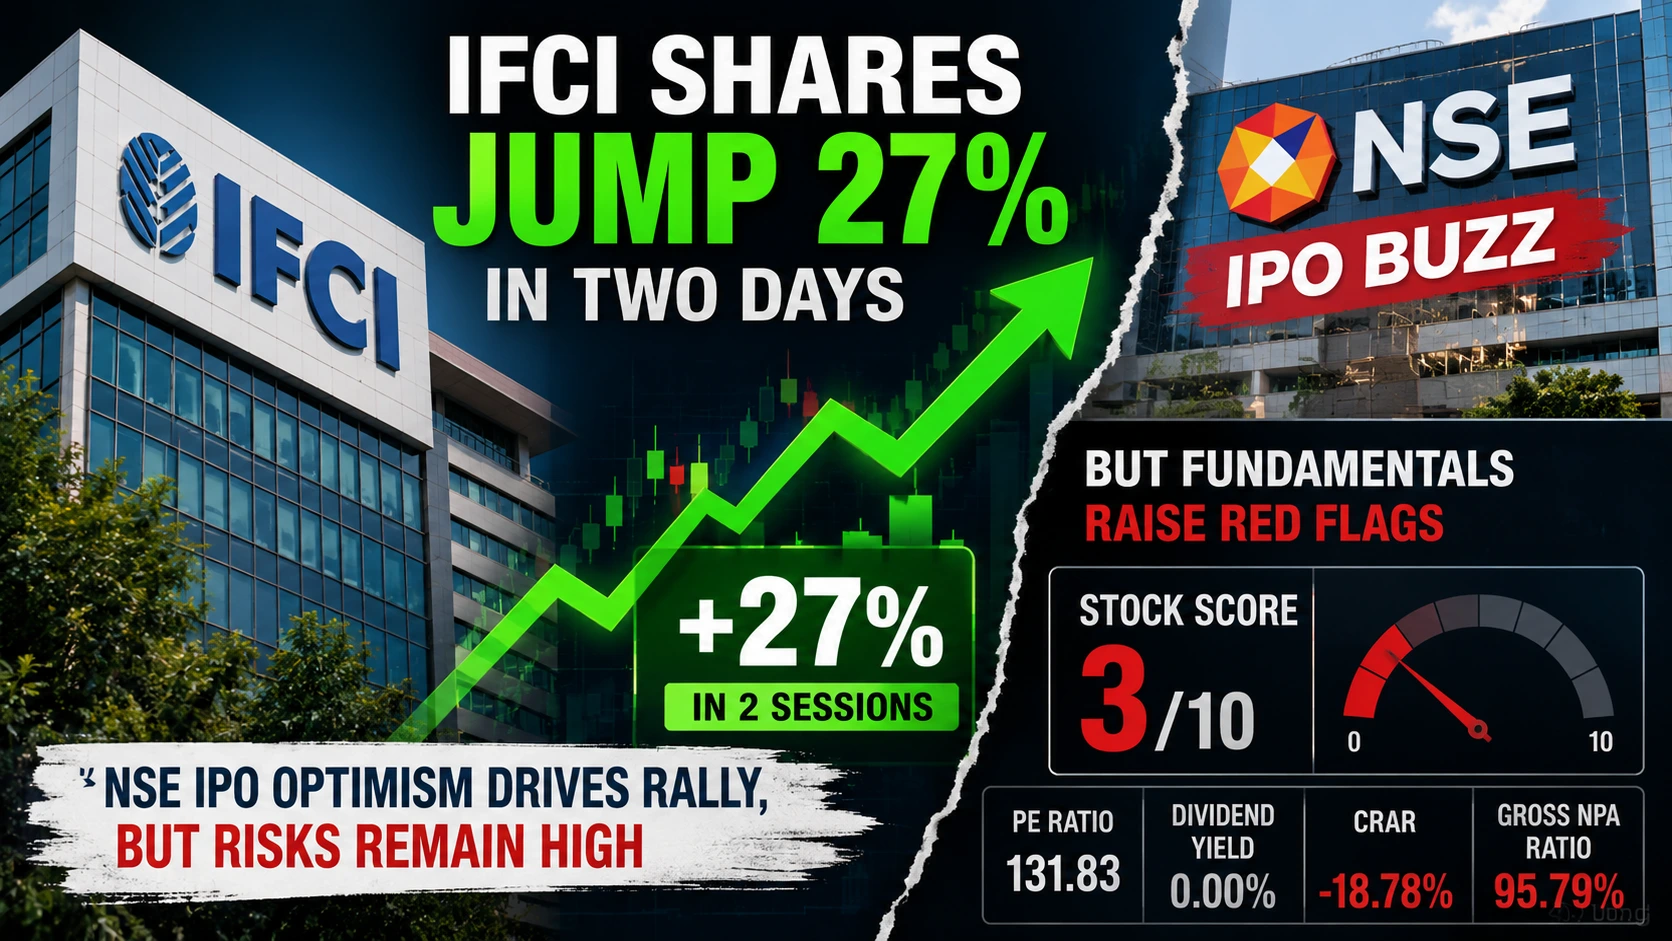
IFCI shares have rallied 27% in just two trading sessions as investors bet on the National Stock Exchange’s long-awaited IPO. However, NiftyTrader data shows weak underlying fundamentals, a Stock Score of just 3/10, and balance-sheet concerns that suggest investors should look beyond the headline-driven rally.
Key Takeaways
- IFCI shares touched a fresh 52-week high of ₹90.45, extending gains to 27% in two sessions.
- The rally is being driven by expectations that NSE could file its IPO papers with SEBI in the coming days.
- IFCI’s effective economic exposure to NSE works out to roughly 2.3% through SHCIL.
- NiftyTrader’s Stock Score for IFCI stands at 3/10, reflecting weak underlying fundamentals.
- IFCI reported a 94% decline in Q4 FY26 consolidated profit, while capital adequacy remains below regulatory requirements.
IFCI Extends Rally as NSE IPO Optimism Intensifies
Shares of IFCI continued their sharp upward move on Monday, touching an intraday high of ₹90.45 and marking a fresh 52-week high. The stock had already hit its upper circuit in the previous session, and the latest move pushed the two-day gain to nearly 27%.
The rally comes amid growing market optimism that the National Stock Exchange (NSE) may finally move ahead with its long-awaited initial public offering (IPO).
Media reports suggest NSE could file its draft red herring prospectus (DRHP) with SEBI in the coming days, although the exchange has not officially confirmed a filing date.
The development has revived investor interest in companies with direct or indirect exposure to the country’s largest stock exchange.
For investors, IFCI has emerged as one of the most visible listed proxies for the NSE IPO theme.
Why the NSE IPO Matters Beyond IFCI
The proposed NSE IPO is expected to be among the largest public offerings in India’s capital market history.
NSE dominates India’s equity derivatives market and remains the country’s largest stock exchange by trading volumes. Recent unlisted-market transactions and media estimates have suggested valuations ranging between ₹4.5 lakh crore and ₹6 lakh crore, although the final IPO valuation will depend on market conditions, regulatory approvals and investor demand closer to the offering.
A successful listing could provide a liquidity event for long-term shareholders, improve price discovery and trigger renewed investor interest in companies that hold direct or indirect stakes in the exchange.
This value-unlocking narrative is at the heart of IFCI’s recent rally.
The IFCI–SHCIL–NSE Ownership Chain
IFCI’s exposure to NSE comes through Stock Holding Corporation of India Ltd (SHCIL), in which IFCI holds a majority stake.
As per the latest available shareholding data, SHCIL owns a 4.4% stake in NSE, while IFCI owns 52.86% of SHCIL.
| Entity | Stake Held |
|---|---|
| IFCI in SHCIL | 52.86% |
| SHCIL in NSE | 4.4% |
| IFCI’s Effective Economic Exposure to NSE | ~2.3% |
This indirect ownership has positioned IFCI as a key beneficiary whenever optimism around the NSE IPO increases.
However, investors should remember that IFCI’s economic exposure is diluted through multiple layers of ownership and is not a direct stake in the exchange itself.
IFCI Share Price Performance
The recent rally adds to what has already been a strong year for the stock.
| Period | Return |
|---|---|
| Last 2 Sessions | +27% |
| 1 Month | +40% |
| CY2026 Till Date | +64% |
| 3 Years | +582% |
| 5 Years | +517% |
The stock’s sharp rise reflects both the excitement around the NSE IPO and broader momentum in PSU-linked counters.
Why NSE’s Valuation May Not Fully Flow Through to IFCI
One key factor often overlooked during holding-company rallies is the “holding company discount.”
Even if NSE eventually lists at a valuation of ₹5 lakh crore to ₹6 lakh crore, there is no guarantee that IFCI shareholders will receive a proportional benefit.
Markets typically assign a discount to companies that own stakes through subsidiaries because multiple ownership layers separate the underlying asset from public shareholders.
In IFCI’s case, investors own IFCI, which owns SHCIL, which in turn owns a stake in NSE.
As a result, a large headline valuation for NSE does not automatically translate into an equivalent increase in IFCI’s intrinsic value.
NiftyTrader Data Check: Stock Score Remains Weak
While the IPO narrative has captured market attention, NiftyTrader’s proprietary data presents a more cautious picture.
| Metric | Value |
|---|---|
| Stock Score | 3 / 10 |
| CMP | ₹89.44 |
| PE Ratio | 131.83 |
| Market Cap | ₹23,844.68 crore |
| PB Ratio | 1.47 |
| Dividend Yield | 0.00% |
| Beta | 2.21 |
| 52-Week Range | ₹46 – ₹90 |
A Stock Score of 3/10 places IFCI in the weaker category within NiftyTrader’s framework.
The PE ratio of 131.83 suggests investors are paying a significant premium relative to current earnings, while the zero dividend yield offers little downside support for long-term investors.
Meanwhile, the stock’s beta of 2.21 indicates volatility that is more than twice that of the broader market.
The Fundamental Picture Remains Challenging
IFCI’s FY26 audited results highlight why the market remains cautious on the company’s underlying fundamentals despite the recent rally.
For Q4 FY26, consolidated net profit declined 94% year-on-year to ₹13.22 crore compared with ₹227.28 crore in the corresponding quarter last year. While revenue increased, profitability remained under pressure.
More importantly, IFCI reported a Capital Risk Adequacy Ratio (CRAR) of -18.78% as of March 31, 2026, which remains below RBI’s regulatory requirement for lending institutions.
The company also reported gross NPAs of ₹3,569.97 crore, translating into a gross NPA ratio of 95.79%.
Although full-year profitability improved modestly, the balance-sheet metrics highlight why investors should evaluate the stock on more than just the NSE IPO narrative.
What Are Institutional Investors Watching?
While retail participation has largely driven the recent momentum, investors should monitor delivery volumes, block deals and institutional activity over the coming sessions.
If domestic institutions and long-term investors begin accumulating the stock, the market may interpret the move as a genuine value-unlocking story.
However, if the rally remains driven primarily by speculative trading volumes, volatility could remain elevated.
Monitoring price action alongside volume trends and derivatives positioning may provide early clues about the sustainability of the move.
What Could Derail the Rally?
Several risks could challenge the current bullish narrative:
- Delay in NSE’s DRHP filing.
- Lower-than-expected IPO valuation.
- Extended regulatory review process.
- Profit booking after a 27% two-day rally.
- Continued holding-company discount.
- Weak IFCI fundamentals overshadowing the IPO theme.
These factors could create a gap between investor expectations and the eventual value unlocked from the NSE listing process.
Track Live: IFCI’s stock score, valuation metrics, technical setup, delivery data, and shareholding trends using NiftyTrader’s Stock Analysis platform.
Investors can also monitor derivatives positioning through the Option Chain tool as the NSE IPO story develops.
Related Reading
- IFCI Hits Upper Circuit on NSE IPO Buzz
- NSE IPO: What Investors Need to Know
- How Stock Exchange IPOs Work in India
Bottom Line
IFCI’s 27% rally is rooted in a legitimate market trigger. The NSE IPO has the potential to become one of India’s biggest listings and could unlock value for shareholders across the ownership chain.
However, the stock’s sharp re-rating suggests investors are increasingly pricing in a favourable NSE IPO outcome. NiftyTrader’s Stock Score of 3/10, a PE ratio above 130, a 94% drop in quarterly profit and capital adequacy concerns highlight meaningful risks beneath the surface.
Investors evaluating IFCI should balance the potential upside from the NSE IPO against the company’s own operating fundamentals rather than focusing solely on the recent price surge.
Data as of June 15, 2026.
Disclaimer: This article is for informational purposes only and should not be construed as investment advice. Stock Score and other proprietary metrics are indicative tools and do not guarantee future performance. Investors should conduct their own research or consult a registered financial advisor before making investment decisions.