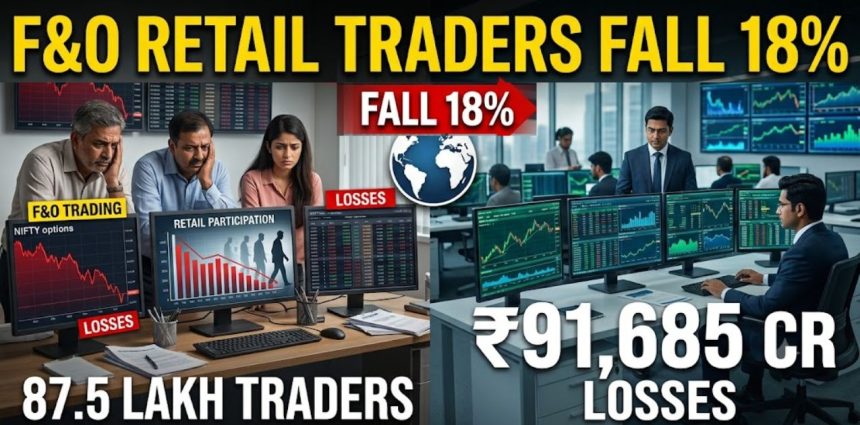
Individual traders exited the derivatives market at a record pace even as aggregate losses eased to ₹91,685 crore — while algorithmic proprietary desks and FPIs kept capturing the profits retail left behind.
Key Takeaways
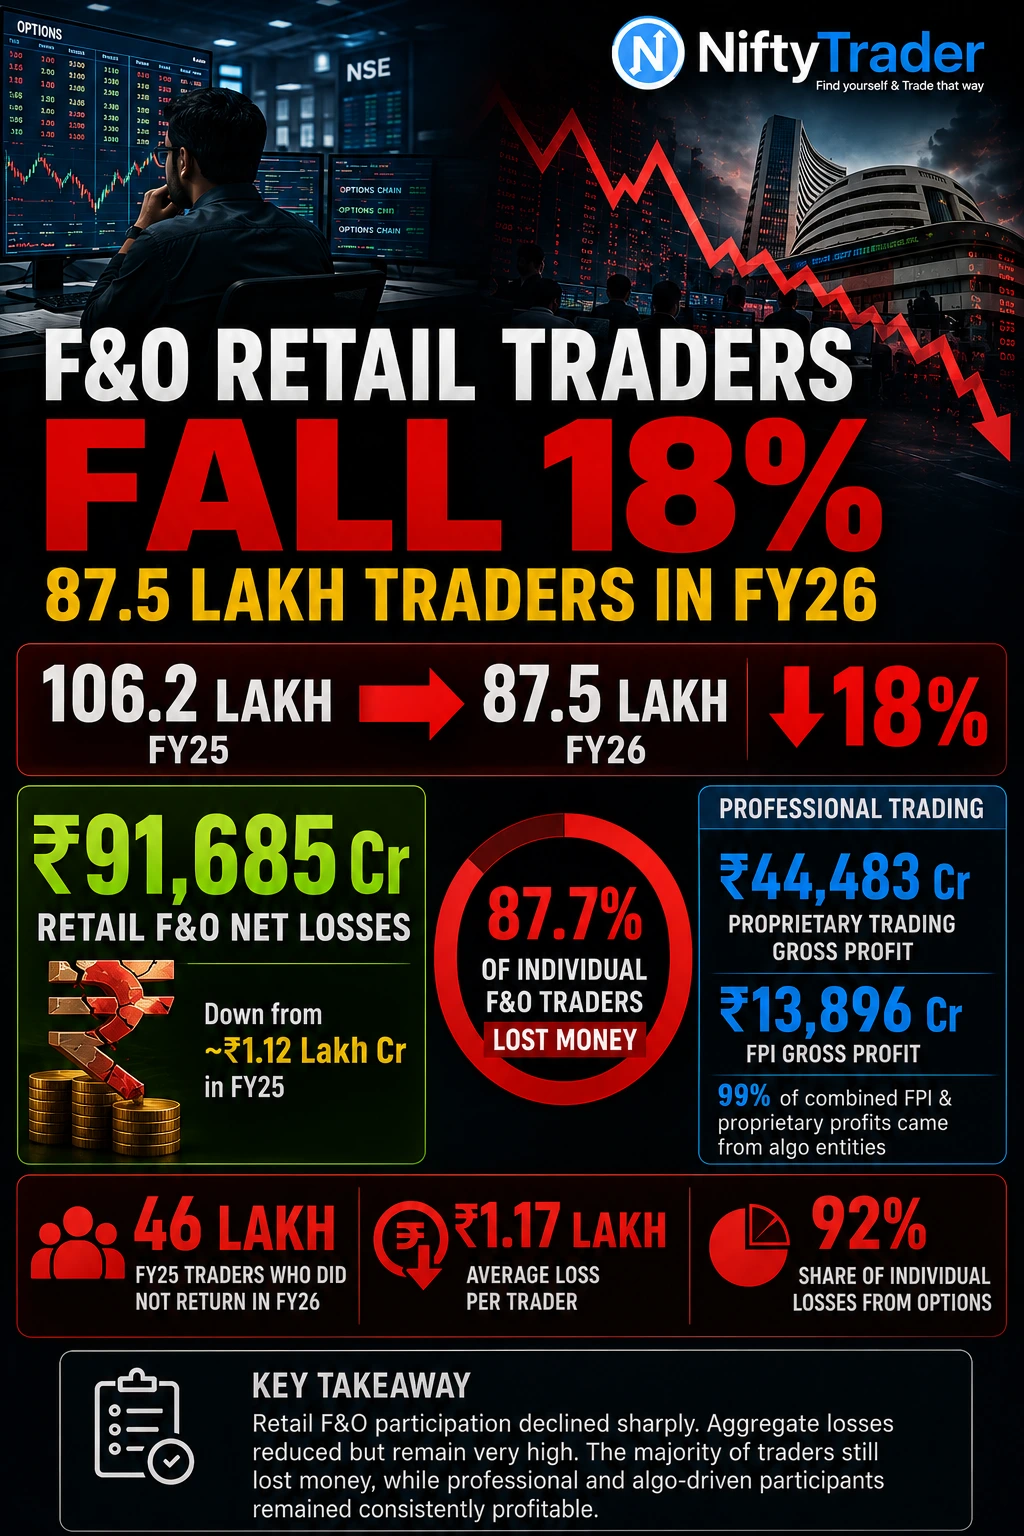
- Individual traders in India’s equity derivatives segment fell 18% year-on-year to 87.5 lakh in FY26 from 106.2 lakh in FY25 — the first annual decline since FY16, SEBI said in a study released on August 20, 2026.
- Aggregate net losses of individual traders declined 18% to ₹91,685 crore in FY26 from a revised ₹1.12 lakh crore in FY25, but the average loss per trader still rose 2%, to ₹1.17 lakh.
- 87.7% of individual traders remained net loss-makers in FY26, down from 90.9% in FY25; options alone accounted for 92% of aggregate individual losses.
- Just 23% of traders accounted for nearly 90% of total losses; within that, small-portfolio, high-turnover traders — 13% of all EDS traders — alone drove 52% of total losses.
- Proprietary desks and FPIs booked gross profits of ₹44,483 crore and ₹13,896 crore respectively — 99% of it generated through algorithmic trading.
- New trader entries fell 40% to 20.8 lakh, while exits jumped 76% to nearly 46 lakh, pushing net trader addition into negative territory for the first time in the study period.
India’s equity derivatives market lost nearly one in five of its individual traders in FY26 — the first such annual decline in a decade, according to a SEBI study released on August 20, 2026.
Active individual traders fell 18% to 87.5 lakh from 106.2 lakh in FY25, even as the financial damage for those who stayed in the market got worse on a per-head basis.
The report, Profitability of Individual Traders in the Equity Derivatives Segment (FY25–FY26), is SEBI’s third such review since January 2023 and the first to fully capture the impact of the regulator’s November 2024 risk-curbing measures alongside the October 2024 hike in Securities Transaction Tax (STT).
Check Live: NiftyTrader: Live Options Analytics & F&O Trading Tools
Trader base shrinks, but the exodus is uneven
New trader entries fell nearly 40% to 20.8 lakh in FY26 from 34.3 lakh in FY25 — well below the FY24 peak of 43.1 lakh.
Exits accelerated sharply: nearly 46 lakh traders who had participated in FY25 did not return in FY26, up 76% from 26 lakh exits the previous year. Net addition, new entrants minus exits, turned negative for the first time in the study period, at −24.9 lakh.
The pullback was concentrated among the smallest participants. Traders with annual turnover below ₹10,000 fell 37%, while those trading above ₹10 crore annually actually rose 3%, even as turnover in that bracket dipped 5%. The market’s shrinking base is skewing toward its most active, highest-turnover users.
Losses fall in aggregate, but rise per trader
Aggregate net losses declined 18% to ₹91,685 crore in FY26 from a revised ₹1.12 lakh crore in FY25 (the FY25 figure was restated after SEBI expanded its broker sample from 13 to 15). Yet the average loss per person edged up 2%, from ₹1.13 lakh to ₹1.17 lakh, fewer traders is not the same as safer trading.
The share of loss-making individuals fell to 87.7% in FY26 from 90.9% in FY25. That’s an improvement, but SEBI cautions it should be read alongside the 20% drop in active traders, a smaller loss-maker share doesn’t necessarily mean outcomes have genuinely improved. Loss-makers lost an average ₹1.47 lakh each, 21% more than the ₹1.22 lakh average profit booked by profit-makers.
Options remain the pain point
Options accounted for 92% of aggregate individual losses in FY26. Loss-maker incidence stood at 87.7% among options traders versus 66.0% among futures traders. Nearly 99.3% of individual traders traded options at least once, while only 6.6% touched futures.
Losses were also sharply concentrated: about 23% of traders accounted for nearly 90% of total losses, and the roughly 4.4 lakh traders who lost more than ₹10 lakh each averaged a ₹30 lakh loss apiece.
Also Check: NSE Option Chain Live — Nifty, Bank Nifty & All F&O Stocks
Small-portfolio traders bore the brunt
Over the combined FY25–FY26 period, traders with equity portfolios under ₹1 lakh, 78% of all EDS participants but holding barely 1% of total portfolio value, generated 51% of derivatives turnover and absorbed about 70% of aggregate losses.
Roughly 35% of all traders had no underlying equity holdings at all, trading derivatives purely on a speculative basis.
The concentration sharpens further within that group: small-portfolio traders with high turnover made up just 13% of all EDS traders, yet contributed 52% of total losses, the single largest loss-concentration bucket SEBI identified.
Within the small-portfolio segment alone, this high-turnover subgroup traded at multiples exceeding 10,000 times their portfolio value, versus roughly 12 times for large-portfolio traders.
Institutional desks profited — mostly through algorithms
While individuals lost money, larger participants gained.
Proprietary trading desks posted gross trading profits of about ₹44,483 crore in FY26 (down just 3% from FY25, the smallest decline among institutional categories), followed by FPIs at ₹13,896 crore (down 55%), corporates at ₹8,092 crore, and mutual funds at ₹2,595 crore.
SEBI noted that 99% of FPI and proprietary trading profits came from “algo entities”, participants who placed at least one algorithmic order during the year.
Algorithmic participation among institutions kept climbing: FPI algo entities on NSE rose to 372 from 306 two years earlier, proprietary algo entities to 323 from 279, and DII algo entities more than doubled to 69 from 33.
Among individuals, only about 15% used algo trading, and SEBI flagged that even this figure is inflated by broker-side auto square-offs rather than genuine self-directed algo strategies.
Track daily institutional buying and selling trends on NiftyTrader’s FII-DII Tracker.
0DTE trading cools, but stays dominant
SEBI’s November 2024 measures, restricting weekly expiries to one index per exchange, raising contract sizes, and tightening margin norms on expiry day, appear to have had a measurable, if partial, effect.
The share of zero-days-to-expiry (0DTE) contracts in index options turnover fell to 59% in FY26 from 70% in FY25. Trading within one day of expiry eased to 75% from 80%. Even so, 97% of index options turnover in FY26 still occurred within a week of expiry.
Average daily turnover in index options, which had dropped 17.4% immediately after the November 2024 curbs, has since recovered and risen 38% between October 2025 and March 2026 versus the prior six months, suggesting participants adapted their trading patterns rather than scaling back permanently.
Demographics: young, lower-income, non-metro traders dominate
Traders below 30 years made up 43% of the FY26 base, up from 31% in FY22, and recorded an 89% loss-maker rate versus 81% for those above 60.
About three-fourths of individual traders reported annual income below ₹5 lakh, and this group accounted for 53% of aggregate losses despite contributing only 43% of turnover.
Beyond-the-top-30-cities (B30) locations supplied 67% of the trader base and nearly half of turnover, even though B30 accounts for only about a quarter of individual mutual fund assets.
Bottom Line
SEBI’s FY26 data confirms its 2024 risk-reduction measures are having an effect, participation is down, expiry-day concentration has eased, and aggregate retail losses have narrowed for the first time in the study period.
But the improvement is shallower than the headline suggests: per-trader losses are still rising, nearly 9 in 10 active traders continue to lose money, and losses remain heavily concentrated among small-portfolio, high-turnover, under-30 participants.
Meanwhile, the market that retail is exiting is becoming more, not less, dominated by algorithm-driven proprietary and FPI desks, which captured 99% of their profits through automated trading.
Whether retail participation stabilizes at this smaller base or keeps shrinking, while professional capital fills the space it vacates, is the key trend to watch as SEBI weighs further calibration of its derivatives framework.
Read Next: Financials Stage a FII Comeback, But the ₹1.06 Lakh Cr Gap Remains
Disclaimer: Equity derivatives trading carries significant risk. SEBI’s own data shows that the large majority of individual traders in the Futures & Options segment have consistently incurred net losses over multiple years. This article is based on SEBI’s official study and news reports and is intended for informational purposes only; it does not constitute investment advice. Readers should consult a SEBI-registered investment advisor before making trading decisions.