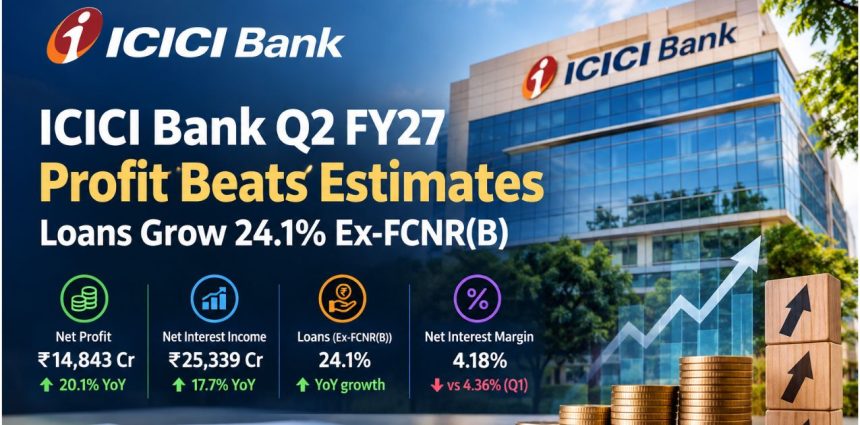
Standalone profit rises 20.1% to ₹14,843 crore, beating the LSEG estimate by 4.2%. Core operating profit grows 21.8%, but loan growth moderates to 24.1% excluding FCNR(B)-linked lending, while underlying sequential NIM compression is closer to 10 basis points.
October 17, 2026
ICICI Bank’s September-quarter results delivered a stronger-than-expected profit increase, but the numbers beneath the headline reveal a more nuanced picture of its growth.
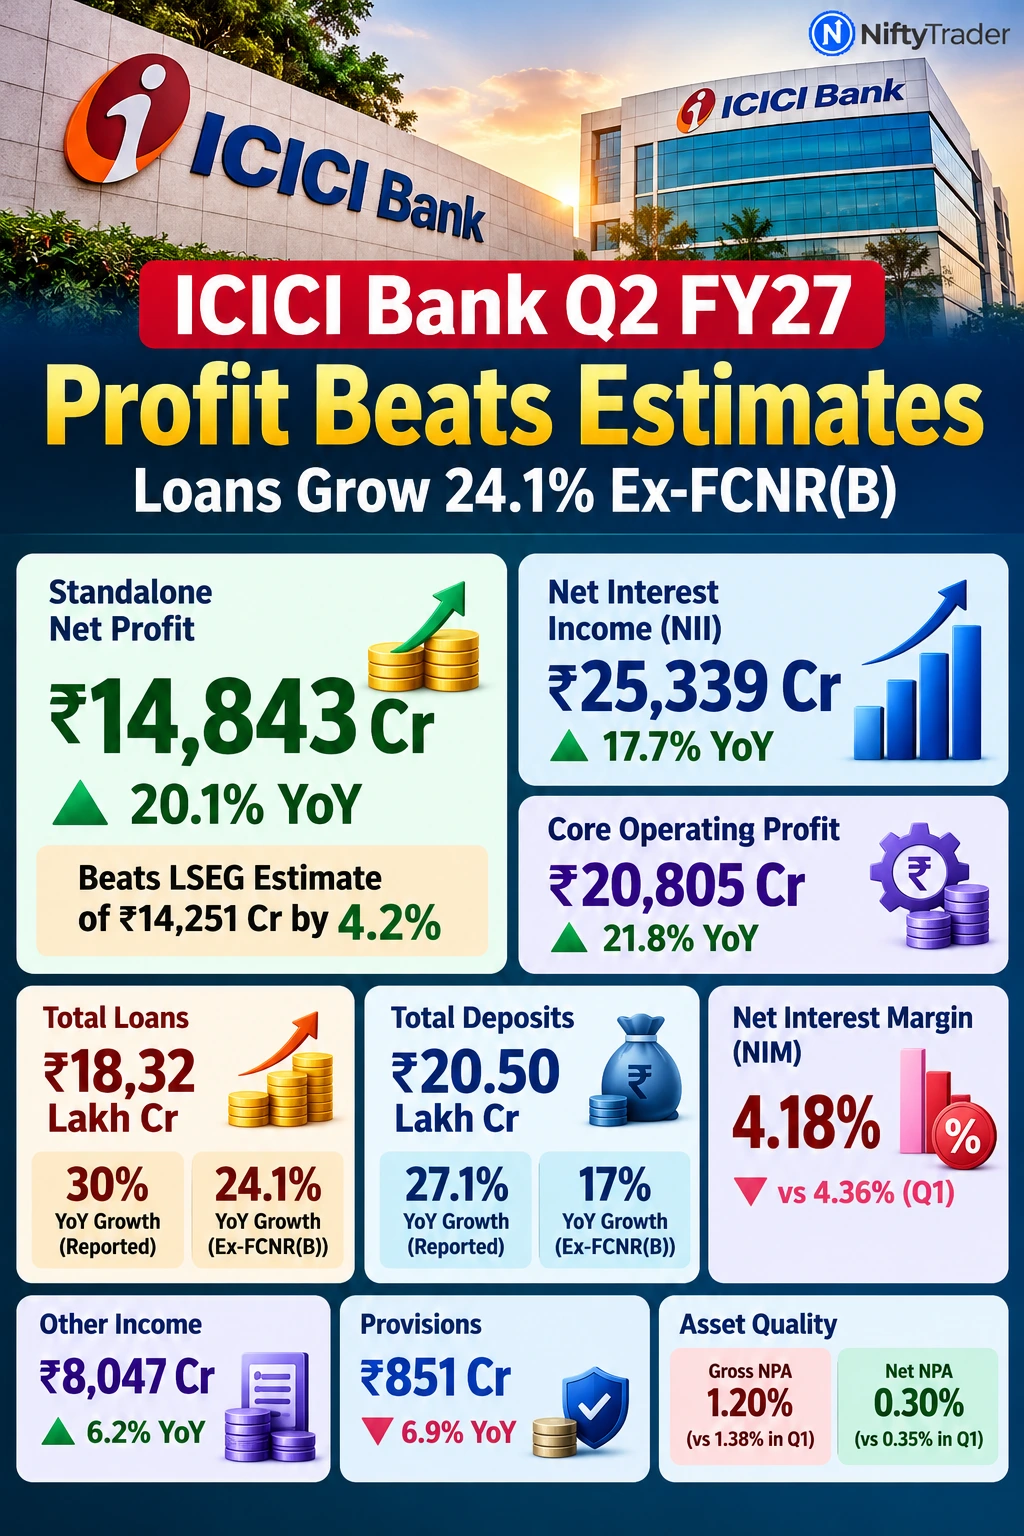
Standalone net profit rose 20.1% year-on-year to ₹14,843 crore, exceeding the LSEG analyst consensus of ₹14,251 crore by approximately ₹592 crore, or 4.2%. Net interest income (NII) increased 17.7% to ₹25,339 crore, while core operating profit climbed 21.8% to ₹20,805 crore.
However, the bank’s reported 30% loan growth moderates to 24.1% after excluding loans extended against FCNR(B) deposits. Net interest margin (NIM) stood at 4.18%, although the underlying sequential decline was closer to 10 basis points after accounting for a tax-refund benefit in the June quarter.
The result therefore combines an earnings beat with two questions for the coming quarters: how sustainably the bank can fund its expanding loan book, and whether margins can stabilise as the benefit from the previous quarter’s tax refunds disappears.
Reuters’ October 17 results report confirmed the profit beat, NII growth and headline margin and asset-quality figures.
Track Live: ICICI Bank Option Chain (ICICIBANK) — Live OI & IV
ICICI Bank Q2 FY27 Results: Key Numbers
| Metric | Q2 FY27 | Comparison |
|---|---|---|
| Standalone net profit | ₹14,843 crore | Up 20.1% YoY |
| LSEG profit estimate | ₹14,251 crore | Actual profit beat by 4.2% |
| Consolidated net profit | ₹16,333 crore | Up 22.3% YoY |
| Net interest income | ₹25,339 crore | Up 17.7% YoY |
| Core operating profit | ₹20,805 crore | Up 21.8% YoY |
| Other income | ₹8,047 crore | Up 6.2% YoY |
| Total loan portfolio | ₹18.32 lakh crore | Up 30% YoY |
| Loan growth excluding FCNR(B)-linked lending | — | Up 24.1% YoY |
| Period-end deposits | ₹20.50 lakh crore | Up 27.1% YoY |
| Deposit growth excluding FCNR(B) | — | Up 17% YoY |
| Net interest margin | 4.18% | Down from 4.36% in Q1 |
| Gross NPA ratio | 1.20% | 1.38% in Q1 |
| Net NPA ratio | 0.30% | 0.35% in Q1 |
| Provisions | ₹851 crore | Down 6.9% YoY |
| Treasury result | ₹230-crore loss | Versus ₹220-crore gain in Q2 FY26 |
YoY means year-on-year. Standalone and consolidated profits are different reporting measures. LSEG refers to the analyst consensus cited by Reuters.
Profit Beats Estimates as Other Income Rises
ICICI Bank’s standalone profit of ₹14,843 crore exceeded the LSEG consensus estimate of ₹14,251 crore by 4.2%. Reuters attributed the better-than-expected outcome to strong loan demand and lower provisions for bad loans, which declined 6.9% year-on-year to ₹851 crore.
Other income increased 6.2% year-on-year to ₹8,047 crore, according to Reuters. This provides additional context for the earnings performance alongside NII and core operating profit.
Other income should not be confused with treasury income. It is a broader reporting category that includes income from bonds and other investments, among other non-interest income sources. Consequently, the 6.2% increase in other income can coexist with a quarterly treasury loss.
The results also outperformed the expectations in one pre-results preview. Financial Express’ October 16 preview projected approximately 14.4% year-on-year profit growth and 16% NII growth for ICICI Bank. The reported increases were 20.1% and 17.7%, respectively.
That comparison is specific to the forecasts published in that preview; it should not be treated as a universal measure of market expectations. The LSEG consensus cited by Reuters provides a separate, quantified benchmark for the profit beat.
Core Operating Profit Grows Faster Than Net Profit
Core operating profit, excluding treasury income, increased 21.8% year-on-year to ₹20,805 crore.
Fee income rose 20.1% to ₹7,795 crore, while operating expenses increased 8.5% to ₹12,811 crore, according to Business Standard’s detailed results report.
The faster increase in core operating profit is important because it indicates that the operating performance was not dependent on favourable treasury movements. NII also increased 17.7% to ₹25,339 crore, supported by expansion in the loan portfolio.
Provisions declined 6.9% year-on-year to approximately ₹851 crore, helping the bottom line. However, the combination of core operating profit growth and lower provisions provides a more complete explanation of the earnings outcome than the reported profit increase alone.
The distinction matters for future quarters. Sustained operating growth would offer more support to earnings if the bank faces additional pressure from funding costs or market-related income.
Also Read: ICICI Bank Q2 Results FY27: NII, NIM and Asset Quality in Focus Before Oct 17
The 30% Loan-Growth Headline Needs Context
ICICI Bank’s total advances increased 30% year-on-year and 12.3% sequentially to ₹18.32 lakh crore as of September 30, 2026.
Excluding loans extended by international branches against FCNR(B) deposits, year-on-year growth was 24.1%, while sequential growth was 7.3%.
Both measures are relevant, but they answer different questions. The reported growth rate captures the expansion of the total loan book, while the ex-FCNR(B) figure provides a narrower comparison after excluding lending linked to these deposits.
Business banking loans grew 33.8% year-on-year, while the domestic corporate portfolio expanded 30.6%. Retail and rural loans grew 14.8% and accounted for 51.6% of the total portfolio, according to the reported results breakdown.
The composition of growth matters because lending segments carry different yields, funding needs and credit risks. The headline loan-growth percentage alone cannot establish how much additional profit each segment will generate.
For investors, the 24.1% ex-FCNR(B) figure is a more informative measure to monitor alongside the reported 30% increase.
Deposits Grow 27.1% as India’s Banking System Hits a Record
Period-end deposits at ICICI Bank increased 27.1% year-on-year to ₹20.50 lakh crore. Excluding FCNR(B) deposits, growth was 17% year-on-year and 3.1% sequentially.
On these ex-FCNR(B) measures, advances grew approximately 7.1 percentage points faster than deposits over the year. That difference does not, by itself, establish a funding shortfall, but it makes deposit mobilisation and funding costs important indicators for the next quarter.
The wider banking-sector trend provides useful context. India’s banking-system deposits reached a record of approximately ₹284 trillion, or ₹284 lakh crore, in the second half of September 2026. Reuters reported that deposits had increased by ₹21.67 trillion during the first six months of FY27, with much of the rise occurring between June and August while the Reserve Bank of India’s discounted swap window was in operation.
The scheme attracted around $133 billion in inflows before the deposit window closed on August 31, according to Reuters’ banking-system deposit report.
This is sector-wide context, not evidence that the same amount or proportion of those flows went to ICICI Bank. It does, however, show that the quarter’s deposit expansion occurred against a broader increase in banking-system liquidity and foreign-currency inflows.
The question for ICICI Bank is whether deposit growth can keep pace with lending demand at a cost that supports margins. Strong deposit growth is helpful, but its composition and pricing determine how much it contributes to sustainable profitability.
NIM Falls to 4.18%, but the Underlying Decline Is Smaller
ICICI Bank’s reported NIM stood at 4.18%, compared with 4.36% in Q1 FY27 and 4.30% in Q2 FY26. The reported sequential contraction was 18 basis points.
That headline comparison needs context. Interest on tax refunds contributed approximately 8 basis points to the June-quarter margin, according to the reported results commentary. The benefit was negligible in Q2.
Removing that benefit brings the comparable Q1 margin to approximately 4.28%. Comparing 4.28% with Q2’s 4.18% indicates an underlying sequential decline of about 10 basis points.
The adjustment is useful because it separates the tax-refund effect from the underlying margin movement. It does not mean that margin pressure has disappeared: NIM still declined on the adjusted comparison.
NII nevertheless rose 17.7% year-on-year to ₹25,339 crore, showing that higher business volumes helped lift net interest income despite the narrower margin.
The remaining uncertainty is how much of the underlying decline came from deposit costs, funding mix and loan yields. The available headline figures do not independently quantify each factor. Investors should watch whether NIM stabilises or faces further pressure as the bank funds continued loan growth.
Asset Quality Improves, While Treasury Records a Loss
ICICI Bank’s gross NPA ratio declined to 1.20% from 1.38% in Q1 FY27 and 1.58% a year earlier. Its net NPA ratio fell to 0.30% from 0.35% in the June quarter and 0.39% a year earlier.
Gross NPA additions stood at ₹4,833 crore, compared with ₹5,034 crore in Q2 FY26. The bank also wrote off gross NPAs worth ₹1,592 crore during the quarter, while the reported provisioning coverage ratio on non-performing loans stood at 75%.
Lower NPA ratios are encouraging, but they should be assessed alongside additions, recoveries, write-offs and the changing size of the loan portfolio. A declining ratio does not automatically mean that all measures of stressed assets have improved.
Treasury operations recorded a loss of ₹230 crore in Q2 FY27, compared with a gain of ₹220 crore in Q2 FY26. The bank had reported a ₹151-crore treasury gain in Q1 FY27, according to its June-quarter performance review.
The Q2 treasury loss was small compared with the core operating profit of ₹20,805 crore. It is worth monitoring, but it is not the central explanation for the quarter’s earnings outcome.
The bank also continued to hold an additional standard-asset provision of ₹1,283 crore relating to its agricultural priority-sector portfolio. This provision, made in Q3 FY26 following an RBI direction, was reported as remaining in place pending review. Its future treatment should not be assumed until a subsequent disclosure confirms any change.
Track institutional activity in banking stocks through NiftyTrader’s FII–DII Tracker.
What Investors Should Watch Next
ICICI Bank’s Q2 FY27 results combine a profit beat with strong operating growth, but they also leave questions about the sustainability of lending and funding trends.
The three indicators to monitor are whether NIM stabilises around 4.18%, whether ex-FCNR(B) deposit growth moves closer to comparable loan growth, and whether asset quality remains firm as the loan portfolio expands.
The key takeaway is that strong operating momentum and narrower margins can coexist. The 4.2% profit beat and 21.8% growth in core operating profit strengthen the earnings picture, while the ex-FCNR(B) loan-growth figure and funding-cost outlook help explain the risks ahead.
The next quarter will show whether ICICI Bank can continue converting loan growth into higher operating earnings without a material further decline in margins.
Read Next: HDFC Bank Q2 FY27 Results: The ₹1,610-Crore Treasury Drop Behind 4.7% Profit Growth
Disclaimer: This article is for informational purposes only and is not investment advice. Readers should verify financial figures against ICICI Bank’s official exchange filings. Investments in securities are subject to market risks.