
Central Bank of India Q2 FY27 Results show strong earnings growth
Central Bank of India delivered a strong earnings performance in the September quarter, with higher lending income and improving asset quality supporting profitability. However, a declining CASA ratio and lower treasury income remain important factors for investors to watch.
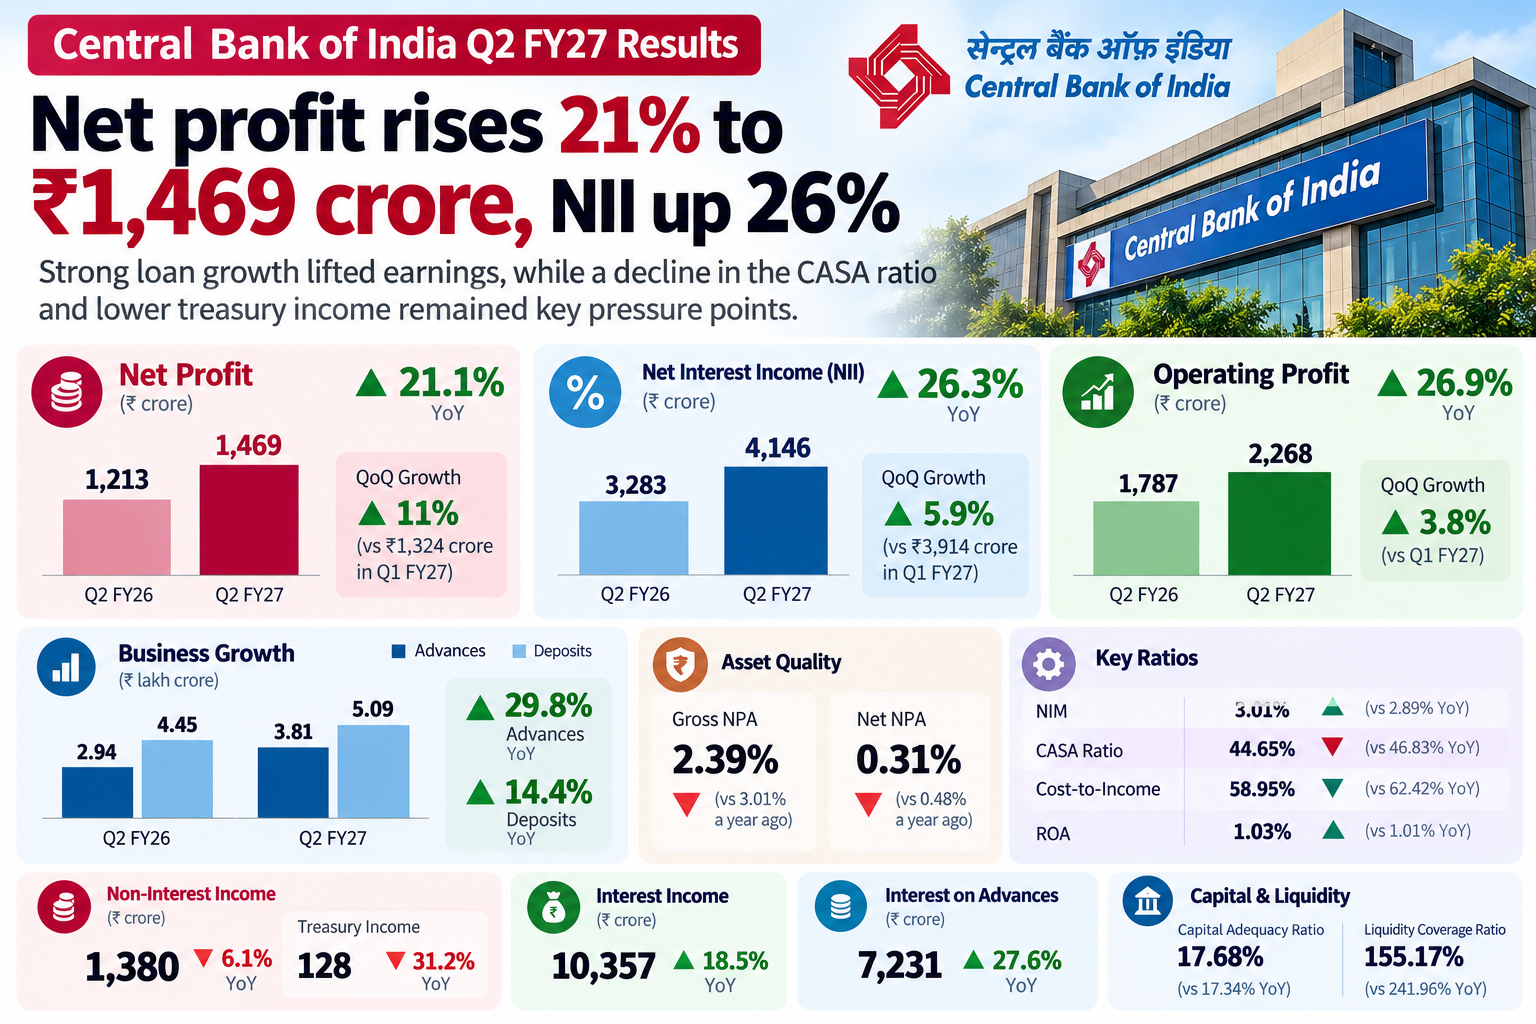
The public sector lender reported a 21.1% year-on-year increase in net profit to Rs 1,469 crore for Q2 FY27. Profit also rose 11% from Rs 1,324 crore in the June quarter, reflecting continued growth in earnings.
Net interest income (NII), the difference between interest earned and interest paid, climbed 26.3% year-on-year to Rs 4,146 crore. Operating profit increased 26.9% to Rs 2,268 crore.
Track Live : NSE Option Chain — Live | BSE Option Chain — Live Sensex & Bankex Options Data Today
Central Bank of India Q2 FY27 Results : NII rises 26.3% as lending income improves
The bank’s core interest income performance was a major driver of its quarterly results. NII increased 5.9% sequentially from Rs 3,914 crore, while operating profit rose 3.8% from the previous quarter.
Net interest margin (NIM) improved to 3.01% from 2.89% a year earlier. Interest income rose 18.5% to Rs 10,357 crore, supported by a 27.6% increase in interest earned on advances to Rs 7,231 crore.
Interest expenses grew at a slower rate of 13.7% to Rs 6,211 crore. The cost of deposits also eased to 4.60% from 4.88% a year earlier, helping support the bank’s interest income performance.
However, non-interest income declined 6.1% to Rs 1,380 crore, while treasury income fell 31.2% to Rs 128 crore. This decline highlights the pressure on income sources outside the bank’s core lending operations.
Key financial numbers at a glance
| Financial metric | Q2 FY27 figure | Comparison |
|---|---|---|
| Net profit | ₹1,469 crore | +21.1% YoY |
| Net profit in Q1 FY27 | ₹1,324 crore | +11% QoQ |
| Net interest income (NII) | ₹4,146 crore | +26.3% YoY |
| NII in Q1 FY27 | ₹3,914 crore | +5.9% QoQ |
| Operating profit | ₹2,268 crore | +26.9% YoY |
| Net interest margin (NIM) | 3.01% | Up from 2.89% a year earlier |
| Non-interest income | ₹1,380 crore | −6.1% YoY |
| Treasury income | ₹128 crore | −31.2% YoY |
Net profit rose 21.1%
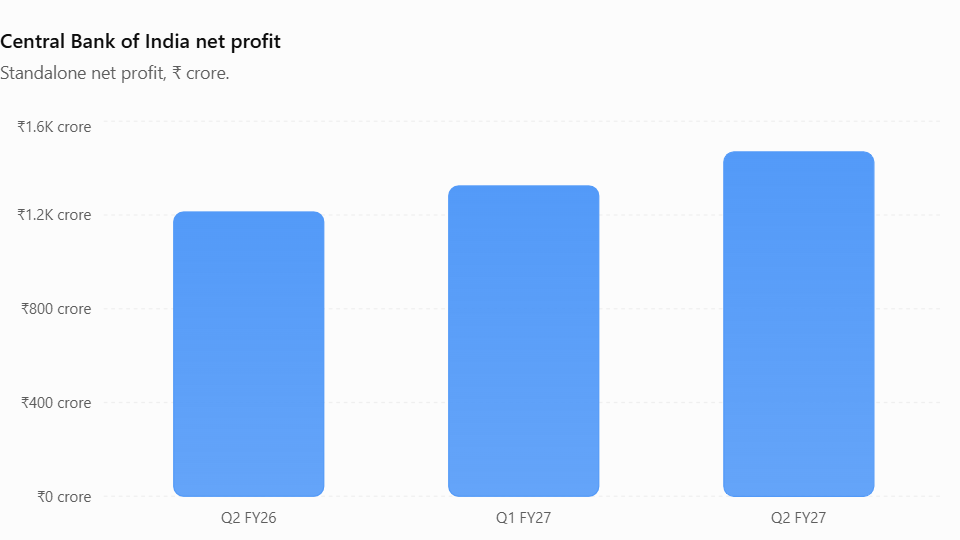
Central Bank of India recorded standalone net profit of ₹1,468.86 crore in Q2 FY27, compared with ₹1,212.88 crore a year earlier. Profit also increased from ₹1,324 crore in Q1 FY27.
| Profit comparison | Amount |
|---|---|
| Q2 FY26 | ₹1,212.88 crore |
| Q1 FY27 | ₹1,324 crore |
| Q2 FY27 | ₹1,468.86 crore |
| Year-on-year growth | 21.1% |
| Quarter-on-quarter growth | Approximately 11% |
The bank’s profit increased by roughly ₹256 crore year on year. The sequential increase suggests that earnings also improved from the June quarter, rather than relying solely on the year-on-year comparison.
NII and operating profit recorded strong growth
Net interest income rose 26.3% year on year to ₹4,146 crore, while operating profit increased 26.9% to ₹2,268 crore.
| Metric | Q2 FY27 | YoY growth | QoQ growth |
|---|---|---|---|
| Net interest income | ₹4,146 crore | +26.3% | +5.9% |
| Operating profit | ₹2,268 crore | +26.9% | +3.8% |
Net interest margin improved to 3.01%
The bank’s NIM increased to 3.01% from 2.89% in the year-earlier quarter.
NIM measures how effectively a bank earns net interest income from its interest-earning assets. A higher margin can support profitability, provided credit costs and operating expenses remain manageable.
The improvement suggests that the bank generated more net interest income relative to its relevant asset base than it did a year earlier. Investors should also monitor whether this margin improvement continues as lending and deposit rates change.
Treasury income declined despite stronger core earnings
Non-interest income fell 6.1% year on year to ₹1,380 crore, while treasury income declined 31.2% to ₹128 crore.
| Income metric | Q2 FY27 | YoY change |
|---|---|---|
| Non-interest income | ₹1,380 crore | −6.1% |
| Treasury income | ₹128 crore | −31.2% |
| Interest income | ₹10,357 crore | +18.5% |
| Interest earned on advances | ₹7,231 crore | +27.6% |
| Interest expenses | ₹6,211 crore | +13.7% |
Advances grew faster than deposits
Central Bank of India’s global advances increased 29.8% year on year to ₹3.81 lakh crore, while domestic deposits grew 14.4% to ₹5.09 lakh crore.
| Business metric | Q2 FY27 | YoY growth |
|---|---|---|
| Global advances | ₹3.81 lakh crore | +29.8% |
| Domestic deposits | ₹5.09 lakh crore | +14.4% |
| Total global business | ₹8.90 lakh crore | +20.5% |
Strong loan growth outpaces deposit expansion at Central Bank of India
Credit growth remained a key highlight of the Central Bank of India Q2 results. Global advances increased 29.8% year-on-year to Rs 3.81 lakh crore, significantly outpacing the 14.4% growth in domestic deposits to Rs 5.09 lakh crore.
The bank’s total global business rose 20.5% to Rs 8.90 lakh crore.
Retail, agriculture and MSME advances collectively grew 21.1%. Within this portfolio, retail advances increased 24.5%, agriculture loans grew 19.9%, and MSME advances rose 17.4%.
However, CASA deposits increased 9.2% to Rs 2.27 lakh crore, while the CASA ratio declined to 44.65% from 46.83% a year earlier. A lower CASA ratio can indicate a reduced share of relatively low-cost current and savings account deposits in the overall deposit base.
Track Live : Nifty Levels Today | Sensex Levels Today
Lending growth by segment
| Loan segment | YoY growth |
|---|---|
| Retail, agriculture and MSME portfolio | +21.1% |
| Retail advances | +24.5% |
| Agriculture advances | +19.9% |
| MSME advances | +17.4% |
Retail lending recorded the fastest growth among the three individual segments listed. Broad-based expansion across retail, agriculture and MSME lending indicates that credit growth was not confined to one category.
Improving asset quality strengthens the bank’s financial position
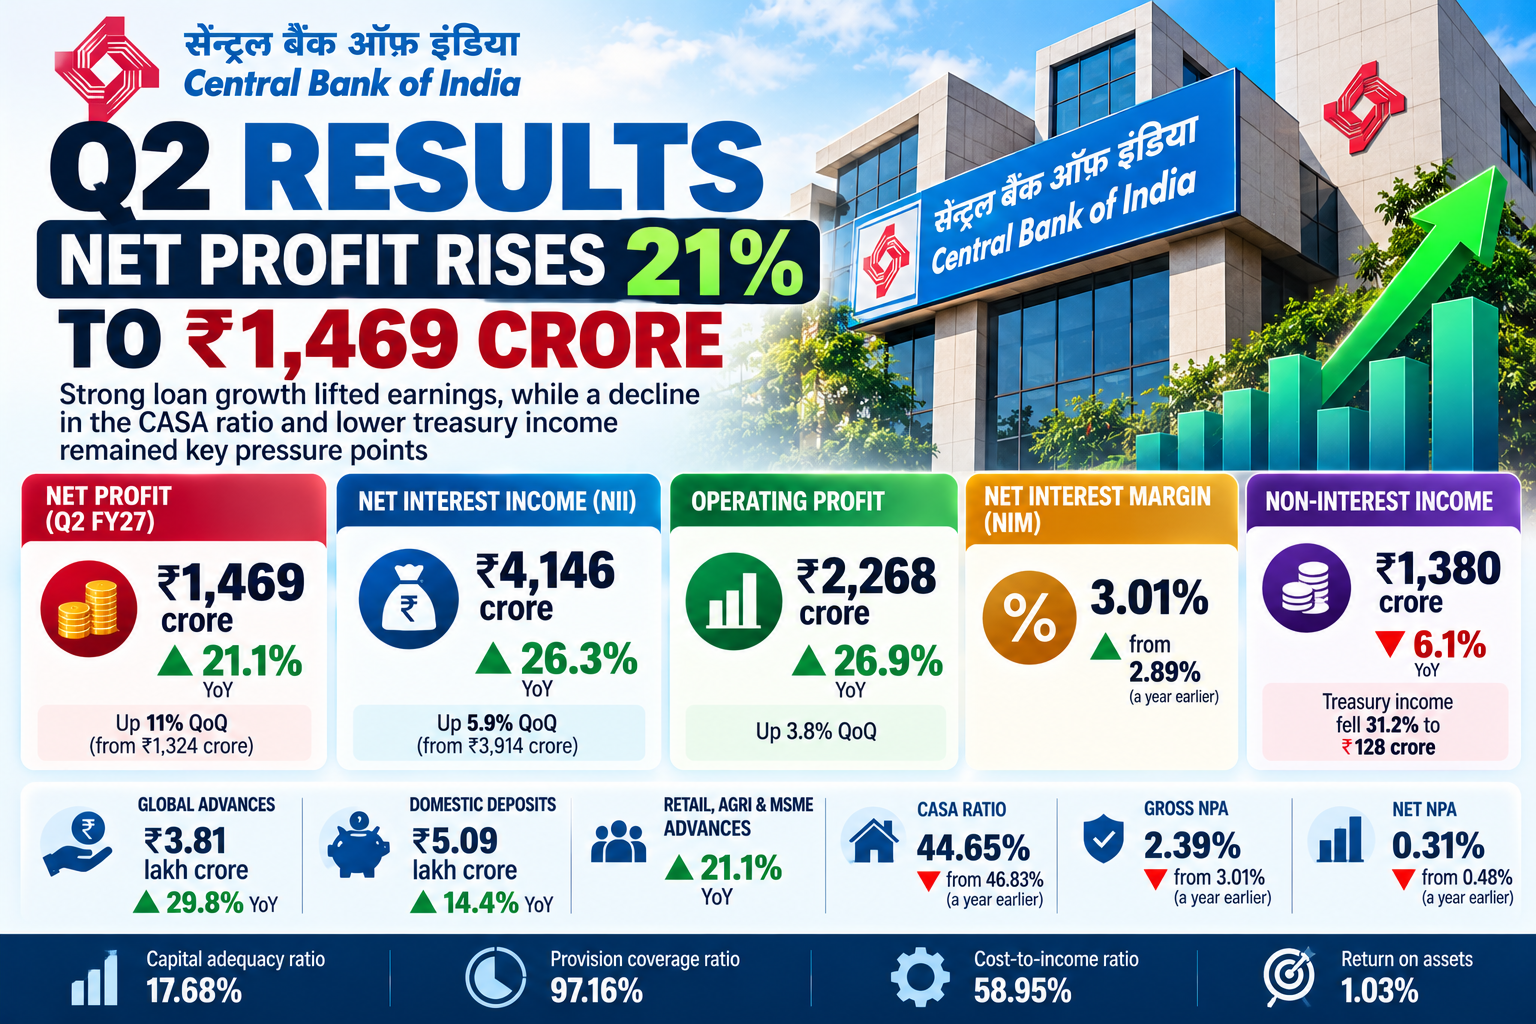
The bank reported a decline in its gross non-performing asset (GNPA) ratio to 2.39% from 3.01% a year earlier. The net NPA ratio also improved to 0.31% from 0.48%.
The provision coverage ratio increased to 97.16% from 96.88%, while the quarterly slippage ratio declined to 0.24% from 0.30%. These indicators suggest improvement in reported asset quality and the bank’s coverage against bad loans.
Return on assets stood at 1.03%, compared with 1.01% in the corresponding period last year.
Read More : Axis Bank Q2 FY27 Results: Has Beaten the Nifty This Year. Will Earnings Extend the Run?
CASA ratio declined despite deposit growth
CASA refers to current account and savings account deposits, which are generally important sources of relatively low-cost funding for banks.
| CASA metric | Q2 FY27 | Comparison |
|---|---|---|
| CASA deposits | ₹2.27 lakh crore | +9.2% YoY |
| CASA ratio | 44.65% | Down from 46.83% |
| Cost of deposits | 4.60% | Down from 4.88% |
Cost-to-income ratio improved
The bank’s cost-to-income ratio declined to 58.95% from 62.42% a year earlier.
| Efficiency metric | Q2 FY27 | Year-earlier figure |
|---|---|---|
| Cost-to-income ratio | 58.95% | 62.42% |
| Full-year target | Below 56% | — |
A lower cost-to-income ratio generally indicates that a bank spends less on operating expenses for each unit of operating income.
Capital adequacy and liquidity
| Capital or liquidity metric | September 2026 | Comparison |
|---|---|---|
| Capital adequacy ratio | 17.68% | 17.34% a year earlier; 18.28% in June |
| CET-1 ratio | 15.97% | 14.98% a year earlier; 16.54% in June |
| Average liquidity coverage ratio (LCR) | 155.17% | 241.96% a year earlier |
| Net stable funding ratio (NSFR) | 126.38% | 150.47% a year earlier |
The capital adequacy ratio and CET-1 ratio remained higher than their year-earlier levels, although both declined from June 2026.
The LCR and NSFR also fell significantly year on year.
-
Capital adequacy: Measures the bank’s capital buffer against risk-weighted assets.
-
LCR: Measures the availability of high-quality liquid assets to cover potential net cash outflows over a 30-day stress period.
-
NSFR: Assesses whether the bank has sufficiently stable funding relative to its assets and off-balance-sheet exposures over a longer horizon.
Asset quality improved
Central Bank of India’s gross and net NPA ratios declined year on year, indicating an improvement in reported loan quality.
| Asset-quality metric | Q2 FY27 | Year-earlier figure |
|---|---|---|
| Gross NPA ratio | 2.39% | 3.01% |
| Net NPA ratio | 0.31% | 0.48% |
| Provision coverage ratio | 97.16% | 96.88% |
| Quarterly slippage ratio | 0.24% | 0.30% |
| Return on assets (RoA) | 1.03% | 1.01% |
Overall assessment of Central Bank of India Q2 FY27 results
| Area | Key finding | Interpretation |
|---|---|---|
| Net profit | ₹1,469 crore, +21.1% YoY | Strong earnings growth |
| NII | ₹4,146 crore, +26.3% YoY | Higher core interest income |
| NIM | 3.01%, up from 2.89% | Improved interest margin |
| Credit growth | Advances up 29.8% | Rapid lending expansion |
| Deposit growth | Up 14.4% | Slower than advance growth |
| CASA ratio | 44.65%, down from 46.83% | Funding mix requires monitoring |
| Treasury income | Down 31.2% | Pressure on non-interest earnings |
| Cost-to-income ratio | 58.95%, down from 62.42% | Improved operating efficiency |
| Asset quality | Gross NPA down to 2.39% | Improved reported credit quality |
| Liquidity | LCR down to 155.17% | Lower buffer than a year earlier |
Overall, Central Bank of India reported solid earnings growth in Q2 FY27. Whether this translates into sustained stock performance will depend on the bank’s ability to maintain loan growth, manage funding costs and improve operating efficiency in the coming quarters.