
Synopsis: HDFC Bank Q2 FY27 results show standalone net profit rising 4.7% to ₹19,510 crore and net interest income growing 9.7% to ₹34,619 crore. However, NIM fell to 3.16%, while treasury trading gains plunged 67.4%. Improving asset quality offers support, but margin pressure remains a key concern.
HDFC Bank’s September-quarter results present a mixed picture for investors. India’s largest private-sector lender increased net interest income by nearly 10%, expanded its loan book and improved its bad-loan ratios. Yet reported profit grew by just 4.7%, as a sharp decline in treasury trading gains weighed on earnings.
The other key development was net interest margin (NIM), which fell to 3.16% from 3.26% in the June quarter. CNBC-TV18 described the September-quarter figure as the bank’s lowest on record.
The contrast matters: HDFC Bank is generating more income from its core lending business, but translating that growth into reported profit remains challenging.
For investors, the central question is whether stronger interest income and improving asset quality can offset margin pressure and volatile treasury earnings in the coming quarters.
Track Live: HDFC BANK Options Chart | Nifty Trader
HDFC Bank Q2 FY27 results: Need to know
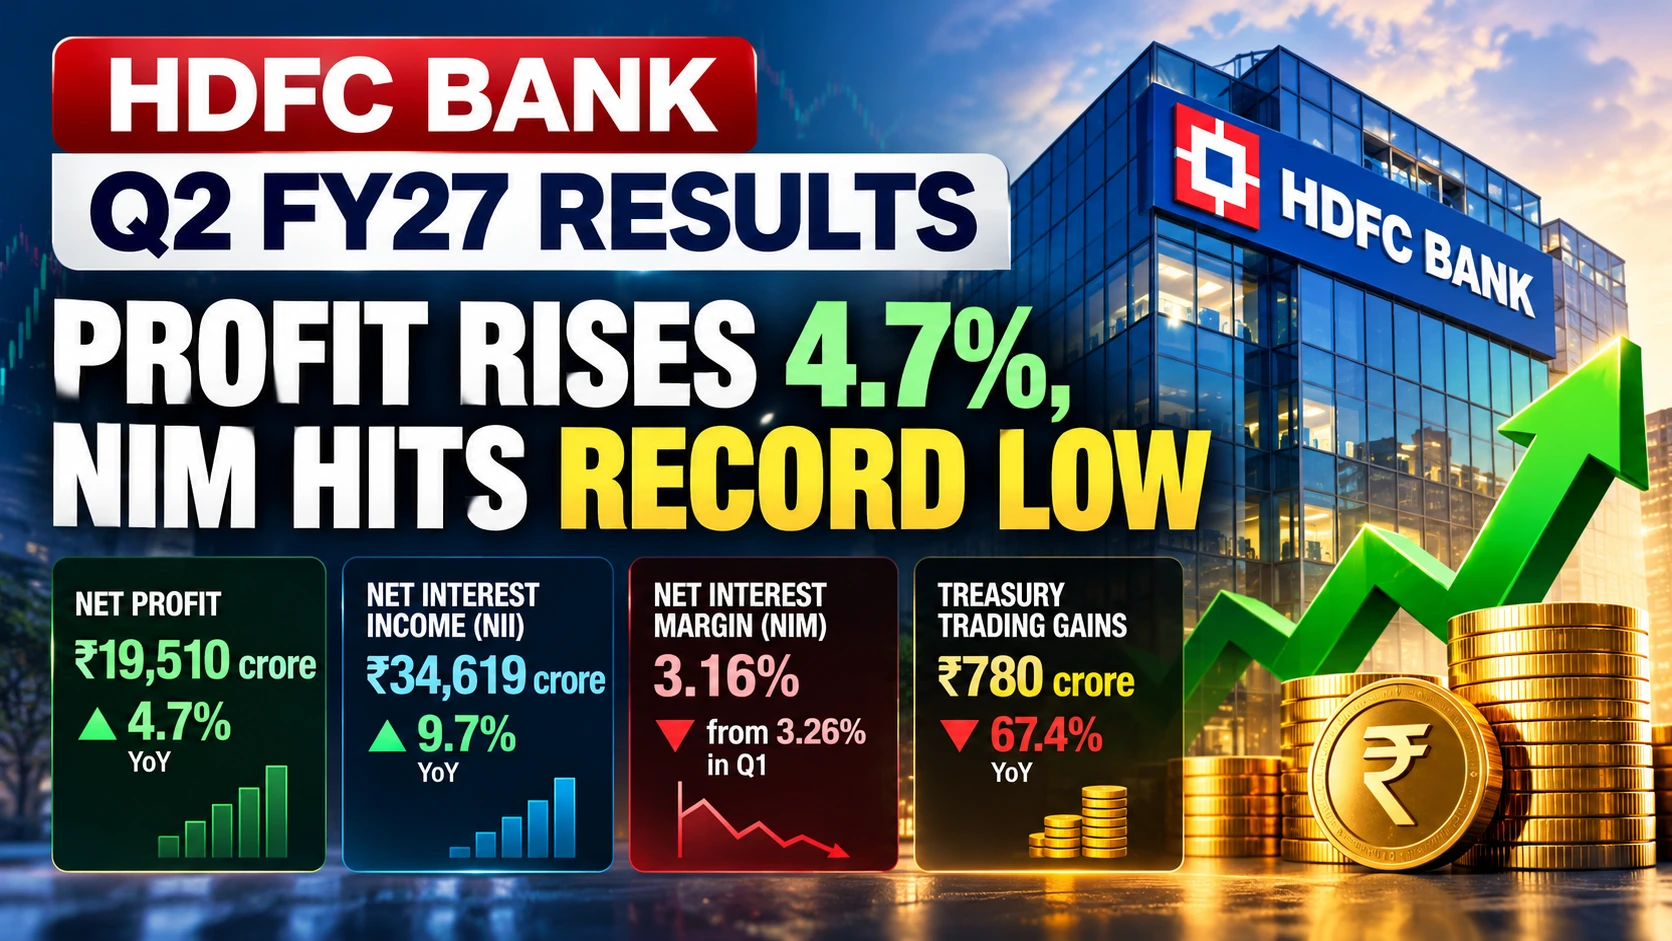
- Net profit: ₹19,509.96 crore, up approximately 4.7% year-on-year.
- Net interest income: ₹34,619.18 crore, up 9.7%.
- Net interest margin: 3.16%, down from 3.26% in Q1 FY27.
- Treasury trading gains: ₹780 crore, down 67.4% year-on-year.
- Gross NPA ratio: 1.11%, compared with 1.17% in the June quarter.
- Deposits and advances: Up 18.8% and 16.3%, respectively, year-on-year.
Sources: HDFC Bank official financial results
HDFC Bank Q2 results: Key financial figures
| Metric | Q2 FY27 | Performance |
|---|---|---|
| Standalone net profit | ₹19,510 crore | +4.7% YoY |
| Net interest income | ₹34,619 crore | +9.7% YoY |
| Net interest margin | 3.16% | Down from 3.26% in Q1 |
| Treasury trading gains | ₹780 crore | Down 67.4% YoY |
| Gross NPA ratio | 1.11% | Improved from 1.17% |
| Net NPA ratio | 0.37% | Improved from 0.41% |
| Gross advances | ₹32.20 lakh crore | +16.3% YoY |
| Period-end deposits | ₹33.27 lakh crore | +18.8% YoY |
| Provisions and contingencies | ₹3,574 crore | +18.7% QoQ |
Figures are rounded. Profit and NII refer to standalone results.
1. Why did profit rise just 4.7% despite strong NII growth?
HDFC Bank reported a standalone net profit of ₹19,509.96 crore, compared with ₹18,641.28 crore a year earlier. The result was slightly below the LSEG consensus estimate of ₹19,526 crore cited by Reuters.
Net interest income, meanwhile, increased 9.7% to ₹34,619.18 crore. The difference between NII growth and reported profit growth is important because it shows that stronger core interest income did not translate into an equivalent increase in the bottom line.
The sharp decline in treasury trading gains was a major factor.
Treasury gains fell to ₹780 crore from ₹2,390 crore in the corresponding quarter last year. Other income declined 3.6% year-on-year to approximately ₹13,831 crore.
Treasury income can fluctuate with bond prices, interest-rate movements and trading activity. As a result, a steep fall in these gains can weigh on reported earnings even when a bank’s lending business continues to expand.
There is a more favourable aspect to the results. CNBC-TV18 reported that profit excluding treasury trading gains grew approximately 12.6% year-on-year. This adjusted comparison suggests that the decline in treasury income obscured stronger underlying earnings growth.
However, the adjusted figure is not the same as reported net profit and should be interpreted separately.
The key test is whether HDFC Bank can sustain core income growth and strengthen reported profitability without relying on volatile market-linked gains.
2. NIM falls to 3.16%: Why investors should pay attention
HDFC Bank’s net interest margin declined to 3.16% in Q2 FY27 from 3.26% in Q1 FY27.
NIM measures the difference between interest earned on interest-generating assets and interest paid on funding, relative to the relevant asset base. It provides insight into how efficiently a bank generates income from its lending and funding operations.
A decline in NIM does not automatically mean that NII will fall. A sufficiently large increase in loans and other interest-generating assets can lift total interest income even when the margin narrows.
That is what makes HDFC Bank’s results more nuanced than the headline profit figure suggests: NII continued to grow, but the return earned relative to its asset base came under pressure.
If the margin remains under pressure, the bank may need stronger balance-sheet growth to generate comparable incremental interest income. Deposit pricing, competition for funding and the yield on new loans will therefore matter in the next quarter.
The September results do not establish whether the margin decline is temporary or persistent. Management commentary and the next earnings update will help investors assess that uncertainty.
Also Check: HDFC Bank Option Chain (HDFCBANK) — Live OI, IV & PCR
3. Asset quality improves, although provisions increase sequentially
Asset quality was a positive part of HDFC Bank’s Q2 performance.
The gross non-performing asset (GNPA) ratio declined to 1.11% at the end of September from 1.17% in June and 1.24% a year earlier. The net NPA ratio improved to 0.37% from 0.41% in the preceding quarter.
In absolute terms, gross NPAs stood at ₹35,810 crore, marginally below ₹35,846 crore in June. Net NPAs declined to ₹11,851 crore from ₹12,357 crore.
The improvement suggests that the proportion of identified bad loans was lower than in the previous quarter. This is encouraging because deterioration in credit quality can require additional provisions and weigh on profitability.
However, provisions and contingencies increased 18.7% sequentially to approximately ₹3,574 crore from ₹3,010 crore in Q1 FY27. They were also about 2.1% higher than a year earlier.
The two trends measure different things. NPA ratios indicate the level of identified bad loans relative to the loan base, whereas provisions reflect charges recognised against potential losses and other contingencies.
The improving NPA ratios are encouraging, but investors should continue tracking provisions and credit costs before concluding that asset-quality risks have fully eased.
4. Loan and deposit growth remains strong, but the mix matters
HDFC Bank’s gross advances rose 16.3% year-on-year to approximately ₹32.20 lakh crore. Period-end deposits increased 18.8% to ₹33.27 lakh crore.
Growth was broad-based across lending categories. Retail loans increased 11.7%, small and mid-market enterprise loans expanded 23.5%, and corporate and other wholesale loans grew 16.4%.
Deposit growth exceeding loan growth is supportive of the bank’s funding position. However, the composition of deposits also matters.
Period-end CASA deposits increased 10.8% year-on-year, while time deposits grew 22.8%. Consequently, CASA accounted for approximately 31.6% of total deposits, compared with around 33.9% a year earlier.
The implication is not that deposit growth is weak. Rather, a growing share of funds is coming from time deposits, making the cost of funding an important variable to monitor.
The bank must balance credit expansion with deposit mobilisation, funding costs and the returns generated from new lending.
For readers interested in the numbers released before the results, see NiftyTrader’s HDFC Bank Q2 FY27 deposit and CASA update.
5. Operating costs, capital and the incoming CEO
Operating expenses increased to approximately ₹18,970 crore from ₹17,980 crore in the year-ago quarter. The cost-to-income ratio stood at 39.1%.
HDFC Bank’s capital adequacy ratio under Basel III was approximately 18.9%, compared with 20% a year earlier. Its CET1 ratio stood at 17.1%.
These figures matter because a bank needs to maintain sufficient capital while expanding credit and managing potential losses. Expense growth also warrants attention when NIM and treasury income are under pressure.
The results come just before Anup Bagchi takes over as managing director and CEO on October 27, 2026, succeeding Sashidhar Jagdishan.
The leadership transition adds another area of investor focus. Market participants will look for management commentary on funding costs, margins, credit growth and operational efficiency. The appointment alone, however, does not establish whether financial performance will improve.
What HDFC Bank investors should watch next
Three issues stand out from the September-quarter results.
First, can NIM stabilise after falling to 3.16%? Second, can the bank maintain strong NII growth without a sustained increase in funding costs? Third, will improving NPA ratios continue alongside manageable provisions?
The answers matter because the bank’s core lending business is expanding, but the earnings benefit is not yet fully reflected in reported profit growth.
HDFC Bank’s results therefore offer both reassurance and caution. Stronger NII, loan growth and improving asset quality support the business outlook. Lower margins and sharply reduced treasury gains, however, leave uncertainty around the pace and consistency of future earnings growth.
The next quarter should provide a clearer indication of whether the bank can convert balance-sheet expansion into stronger reported profitability.
Read Next: Federal Bank Q2 FY27: Profit Jumps 45%, NIM Hits 3.32% as NPAs Fall to Decade Lows
Frequently asked questions
What was HDFC Bank’s Q2 FY27 net profit?
HDFC Bank reported standalone net profit of ₹19,509.96 crore, up approximately 4.7% year-on-year.
How much did HDFC Bank’s NII grow?
Net interest income increased 9.7% year-on-year to ₹34,619.18 crore.
Why is the NIM decline important?
NIM fell to 3.16% from 3.26% in the June quarter. Sustained margin pressure could make it harder for the bank to translate loan growth into stronger earnings.
Did asset quality improve?
Yes. The gross NPA ratio declined to 1.11% from 1.17%, while the net NPA ratio fell to 0.37% from 0.41%.
When does Anup Bagchi take over as CEO?
Anup Bagchi is scheduled to become managing director and CEO on October 27, 2026.
Disclaimer: This article is for informational and educational purposes only and is not investment advice or a recommendation to buy, sell or hold any security. Figures should be checked against official company and stock-exchange disclosures. Investments in securities are subject to market risks.