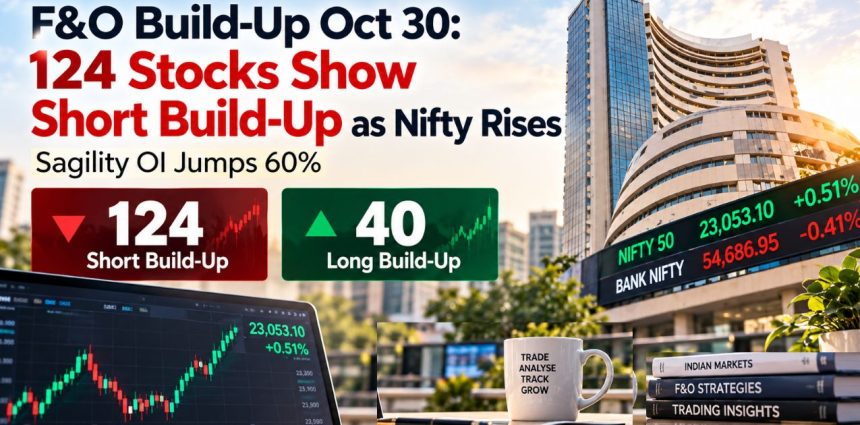
F&O Market Report, October 30, 2026: The Nifty 50 closed 0.51% higher, but 124 of 218 November stock-futures contracts showed a short build-up against just 40 long build-ups. Sagility, Swiggy and Suzlon recorded substantial additions to open interest amid falling prices, while Coforge, Ather Energy and Zydus Lifesciences showed positive price-OI combinations.
Friday, 30 October 2026
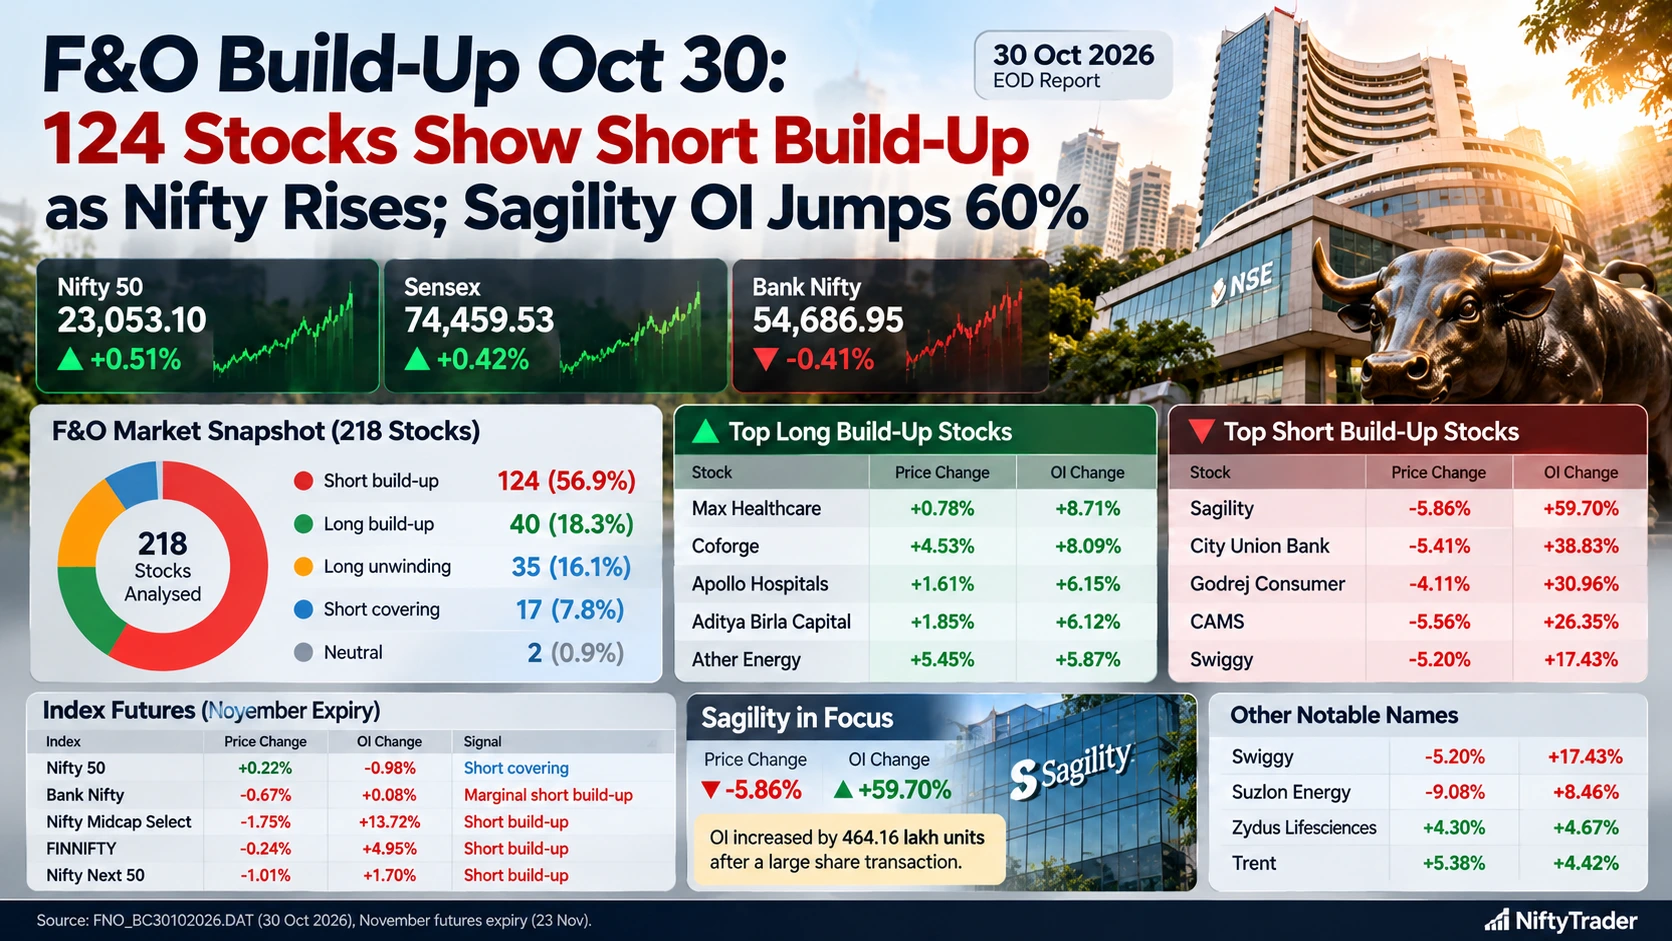
The Nifty 50 reclaimed 23,000 on Friday, October 30, but the closing derivatives data revealed a striking disconnect between benchmark performance and individual stock positioning. Of 218 November stock-futures contracts analysed, 124 showed short build-up, compared with just 40 showing long build-up.
The Nifty gained 116.35 points, or 0.51%, to settle at 23,053.10. The Sensex advanced 308.49 points, or 0.42%, to 74,459.53. Bank Nifty, however, slipped 0.41% to 54,686.95.
Beneath those index moves, several stocks recorded substantial additions to open interest (OI) while their futures prices declined.
Sagility’s November futures OI surged 59.70% as its price fell 5.86%. Godrej Consumer Products, CAMS, Swiggy and Suzlon Energy also showed short-build-up patterns.
Coforge, Ather Energy, Zydus Lifesciences and Trent moved in the opposite direction, registering higher futures prices alongside expanding OI.
The analysis uses the 30 October end-of-day F&O bhavcopy and the 23 November 2026 futures expiry, with raw OI changes calculated against the previous session’s outstanding positions.
Track Live: NIFTY 50, SENSEX, BANK NIFTY
October 30 F&O Report: 124 Short Build-Ups, Only 40 Long Build-Ups
The closing data showed a clear imbalance across the November stock-futures universe.
| F&O classification | Stocks | Share |
|---|---|---|
| Short build-up | 124 | 56.9% |
| Long build-up | 40 | 18.3% |
| Long unwinding | 35 | 16.1% |
| Short covering | 17 | 7.8% |
| Neutral | 2 | 0.9% |
| Total | 218 | 100% |
Source: Calculated from the supplied FNO_BC30102026.DAT, trade date 30 October 2026; November stock futures expiring 23 November.
An additional finding is that 159 contracts, or approximately 72.9% of those analysed, recorded falling futures prices. These comprised 124 short-build-up and 35 long-unwinding classifications.
The broader market was similarly uneven. IT and pharmaceutical shares helped the benchmark indices finish higher, while weakness persisted across several other sectors.
The market-wide OI distribution does not prove that traders collectively held a net bearish position. Every futures contract has both a long and a short side. Instead, it shows that falling prices accompanied by expanding outstanding positions were unusually widespread in the analysed contracts.
Top Long Build-Up Stocks on October 30
The following stocks recorded higher November futures prices and increasing raw OI.
| Stock | Futures price change | Previous → Closing OI (lakh units) | OI change |
|---|---|---|---|
| Max Healthcare | +0.78% | 140.14 → 152.34 | +8.71% |
| Coforge | +4.53% | 100.46 → 108.59 | +8.09% |
| Apollo Hospitals | +1.61% | 16.32 → 17.32 | +6.15% |
| Aditya Birla Capital | +1.85% | 329.36 → 349.53 | +6.12% |
| Ather Energy | +5.45% | 46.88 → 49.63 | +5.87% |
| Eternal | +1.31% | 1,231.80 → 1,301.55 | +5.66% |
| Zydus Lifesciences | +4.30% | 97.17 → 101.71 | +4.67% |
| Trent | +5.38% | 80.53 → 84.08 | +4.42% |
Ranked by percentage increase in raw November futures OI, restricted to contracts with at least 10 lakh underlying units of closing OI. This is an OI-size filter, not a standardised liquidity test.
Coforge: Futures Gain 4.53% With OI Up 8.09%
Coforge emerged as one of Friday’s stronger price-and-OI combinations.
Its November futures closed at ₹2,058, compared with ₹1,968.90 in the previous session, a gain of 4.53%.
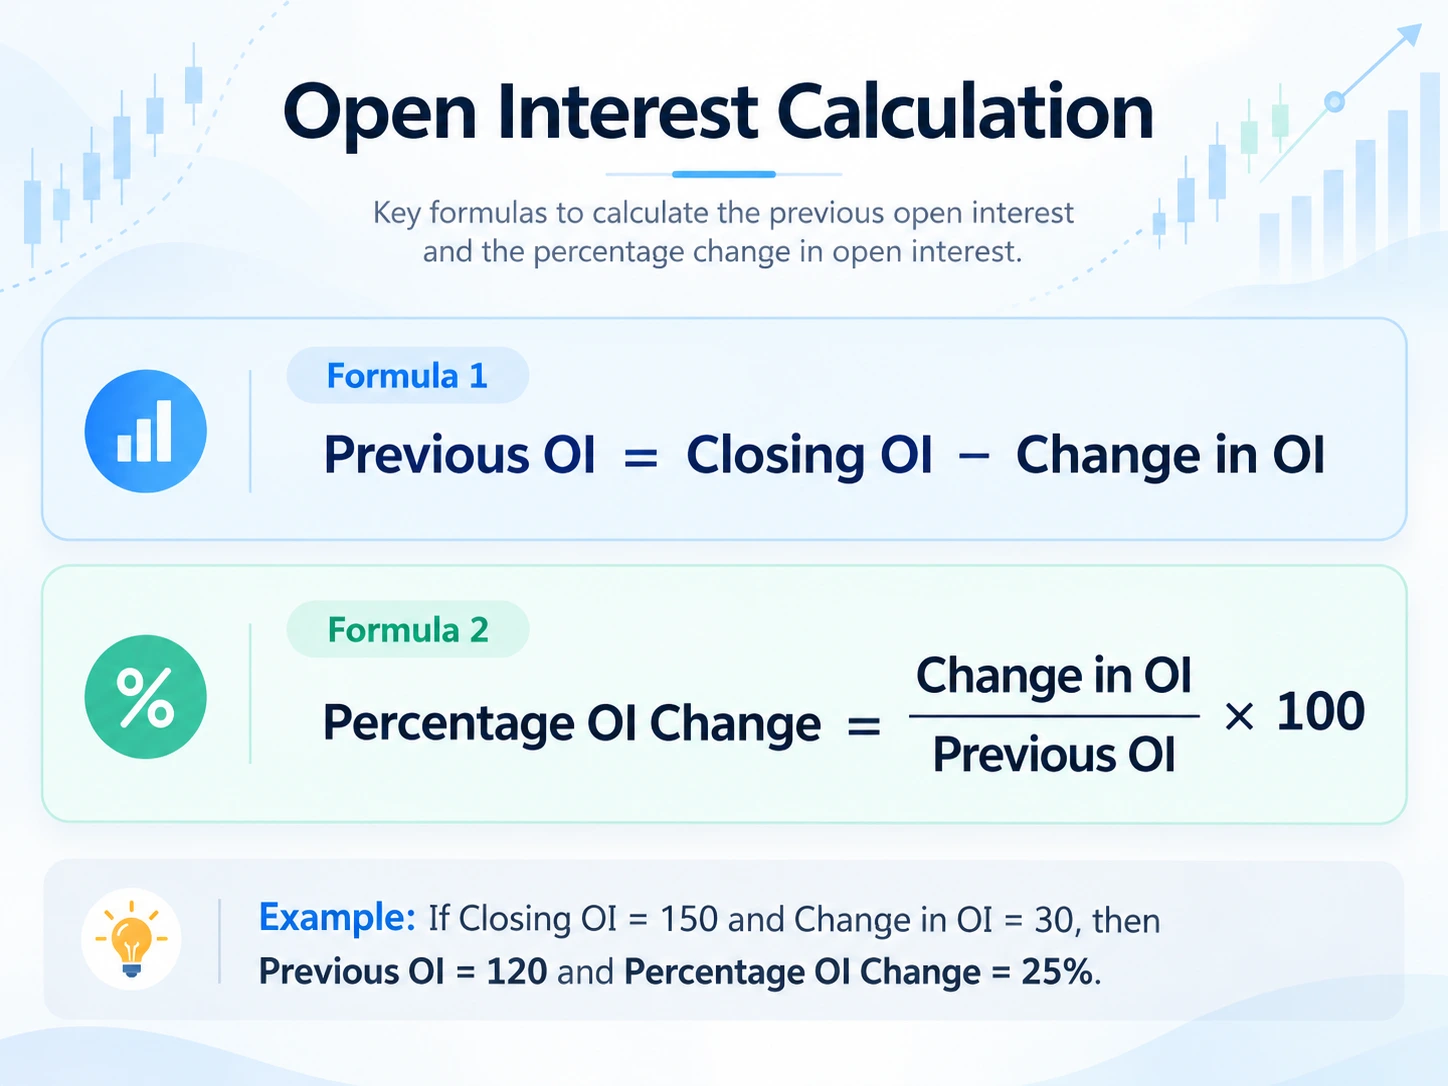
Open interest expanded by 8.13 lakh units to 108.59 lakh units, representing an 8.09% increase.
The move occurred amid a broader recovery in Indian technology shares. According to Reuters, the Nifty IT index gained approximately 17.7% during October, marking its strongest monthly performance in more than six years.
Coforge’s futures data is consistent with the conventional long-build-up classification. However, the bhavcopy cannot independently establish whether new positions were created by institutional investors, hedgers or other market participants.
Ather Energy, Zydus and Max Healthcare Show Different Strengths
Ather Energy’s November futures gained 5.45% to ₹1,758.60, while OI increased 5.87% to 49.63 lakh units.
Zydus Lifesciences advanced 4.30% to ₹1,248.10, accompanied by a 4.67% rise in OI to 101.71 lakh units.
Max Healthcare recorded an even larger OI percentage increase of 8.71%, taking outstanding positions to 152.34 lakh units. Its futures price, however, rose a comparatively modest 0.78%.
These differences matter. A higher OI percentage does not necessarily indicate stronger price momentum.
Eternal and Trent also showed positive positioning. Eternal added approximately 69.74 lakh underlying units of OI, while Trent’s November futures gained 5.38% alongside 4.42% OI growth.
Trent’s move followed its Q2 FY27 results, which showed approximately 22% consolidated revenue growth and improved operating performance.
Navin Fluorine: Why a 72.79% OI Jump Did Not Lead the Main Table
Navin Fluorine recorded the highest raw percentage increase among the long-build-up contracts analysed.
Its November futures gained 4.79%, while OI surged 72.79%.
However, the percentage increase came from a relatively small previous OI base of 1.14 lakh units. Closing OI stood at only 1.97 lakh units, with an actual addition of 82,875 units.
By comparison, Coforge added approximately 8.13 lakh units, and Max Healthcare added 12.20 lakh units.
Navin Fluorine therefore leads the unfiltered percentage ranking, but it is excluded from the main OI-size-filtered table. This avoids presenting a large percentage increase from a small base as automatically more significant than additions in larger contracts.
Top Short Build-Up Stocks on October 30
Short build-up was the dominant classification, with 124 contracts recording declining futures prices and rising OI.
| Stock | Futures price change | Previous → Closing OI (lakh units) | OI change |
|---|---|---|---|
| Sagility | -5.86% | 777.48 → 1,241.64 | +59.70% |
| City Union Bank | -5.41% | 16.23 → 22.53 | +38.83% |
| Godrej Consumer | -4.11% | 102.91 → 134.78 | +30.96% |
| CAMS | -5.56% | 92.41 → 116.76 | +26.35% |
| Swiggy | -5.20% | 684.70 → 804.04 | +17.43% |
| Motilal Oswal Financial Services | -5.41% | 56.45 → 66.22 | +17.31% |
| Cholamandalam Investment | -1.24% | 115.76 → 127.40 | +10.06% |
| Adani Ports | -1.31% | 135.54 → 148.87 | +9.84% |
Ranked by raw OI percentage growth using the same 10-lakh closing-OI filter. The complete unfiltered dataset also contains high-percentage changes in smaller-OI contracts, including Karur Vysya Bank and Data Patterns.
Sagility: Nearly 60% OI Jump Following Large Share Transaction
Sagility stood out in Friday’s short-build-up data.
Its November futures declined from ₹44.70 to ₹42.08, a fall of 5.86%.
Outstanding OI increased from 777.48 lakh to 1,241.64 lakh units—an addition of 464.16 lakh units, or 59.70%.
The stock was also in focus following a substantial equity transaction.
CNBC-TV18 reported that approximately 59.3 crore Sagility shares changed hands shortly after the market opened, at an average price of approximately ₹43 per share. The estimated transaction value was ₹2,543 crore.
Earlier reports had suggested that promoter Sagility B.V. was planning a significant stake sale. The final seller identity and resulting ownership changes require confirmation through exchange disclosures.
The coincidence of a large cash-market transaction and a sharp futures OI increase makes Sagility particularly noteworthy.
However, the data does not prove that the transaction directly caused the new futures positions.
Godrej Consumer and CAMS: Substantial OI Additions
Godrej Consumer Products’ November futures declined 4.11% to ₹805.10, while OI jumped 30.96% to 134.78 lakh units.
The company had announced its Q2 FY27 earnings on October 29, reporting approximately 14% growth in consolidated net profit to ₹523 crore and 19% revenue growth to ₹4,413 crore.
Despite positive reported profit growth, higher costs and margin pressures remained relevant considerations.
CAMS recorded a 5.56% decline in November futures alongside a 26.35% increase in OI, equivalent to approximately 24.35 lakh additional underlying units.
Both stocks illustrate that sizeable OI expansion can accompany sharp price declines across unrelated sectors. The price-OI relationship establishes the classification, but not a single definitive cause for the movement.
Swiggy and Suzlon: Large Absolute OI Increases
Swiggy’s November futures fell 5.20% to ₹176.80, while OI increased from 684.70 lakh to 804.04 lakh units.
That represents an addition of 119.34 lakh units, or 17.43%.
The increase was substantial in both percentage and absolute terms, making Swiggy one of Friday’s notable short-build-up stocks.
Suzlon Energy experienced an even steeper futures price decline of 9.08%, closing at ₹33.53.
Its OI increased 8.46%, adding approximately 386.97 lakh units to reach 4,963.67 lakh units.
Suzlon’s move followed its September-quarter results, which showed 26% revenue growth but a contraction in EBITDA margin to 14.8% from 18.6%.
Although Suzlon ranked below the filtered top eight by OI percentage growth, its large outstanding position and sharp price decline make it important to the broader analysis.
The contrast between Sagility, Swiggy and Suzlon also shows why percentage changes and absolute OI additions should be considered together.
Short Covering and Long Unwinding: Not Every Move Signals Fresh Positions
Friday’s data also identified contracts where outstanding positions declined.
| Stock | Futures price change | OI change | Classification |
|---|---|---|---|
| Wipro | +3.86% | -2.14% | Short covering |
| Infosys | +2.90% | -0.44% | Short covering |
| IndiGo | +3.37% | -1.31% | Short covering |
| Power Grid | +0.75% | -2.13% | Short covering |
| SBI | -0.95% | -0.38% | Long unwinding |
| Axis Bank | -1.18% | -0.45% | Long unwinding |
| IDFC First Bank | -2.08% | -0.74% | Long unwinding |
Wipro’s futures rose 3.86%, but OI declined 2.14%. This is conventionally classified as short covering rather than long build-up.
Infosys and IndiGo displayed similar price-up, OI-down relationships.
Conversely, SBI, Axis Bank and IDFC First Bank recorded falling futures prices alongside declining OI, consistent with long unwinding.
These distinctions are important because a rising stock does not necessarily attract fresh outstanding futures positions, just as a falling stock does not necessarily experience new short build-up.
Index Futures: Nifty Short Covering, Midcap Contracts Show Pressure
The index-futures data reinforced the divergence seen across individual stocks.
| November index futures | Price change | OI change | Classification |
|---|---|---|---|
| Nifty 50 | +0.22% | -0.98% | Short covering |
| Bank Nifty | -0.67% | +0.08% | Marginal short build-up |
| Nifty Midcap Select | -1.75% | +13.72% | Short build-up |
| FINNIFTY | -0.24% | +4.95% | Short build-up |
| Nifty Next 50 | -1.01% | +1.70% | Short build-up |
All figures refer to the 23 November 2026 futures contracts, not the cash indices.
November Nifty futures closed at ₹23,098.90, up 0.22%, while OI declined 0.98%. The combination is consistent with short covering.
Bank Nifty futures declined 0.67%, but OI increased only 0.08%, indicating very limited net expansion in outstanding positions.
Nifty Midcap Select futures presented a more pronounced pattern. The contract declined 1.75%, while OI increased 13.72%.
This comparison is particularly significant. While heavyweight stocks helped the Nifty finish higher, midcap futures exhibited a much weaker price-OI relationship.
What the October 30 Data Means for Traders
Open interest measures outstanding derivative contracts, while trading volume measures activity during a period.
The four common classifications are straightforward: rising price with rising OI indicates long build-up; falling price with rising OI indicates short build-up; rising price with falling OI indicates short covering; and falling price with falling OI indicates long unwinding.
However, these patterns are descriptive indicators, not guarantees of future direction.
The October 30 analysis uses raw closing OI for a single November expiry, rather than combining different expiry months or relying on scanner-adjusted percentages.
For subsequent sessions, the main question is whether the patterns persist.
Continued price weakness alongside rising OI would maintain the conventional short-build-up classification in stocks such as Sagility, Swiggy and Suzlon. For Coforge, Ather Energy and Zydus Lifesciences, further price gains accompanied by OI expansion would maintain their long-build-up classification.
A reversal in either price or OI could change those readings substantially.
The broader market also faces uncertainty from elevated crude oil prices, geopolitical tensions and the next round of corporate earnings.
Bottom Line
The most important finding from October 30’s F&O closing data is the contrast between benchmark resilience and stock-specific weakness.
The Nifty gained 0.51%, but 124 of 218 November stock-futures contracts showed short build-up, compared with just 40 showing long build-up.
Sagility’s 59.70% OI increase stood out, while Swiggy, Godrej Consumer, CAMS and Suzlon recorded notable additions alongside price declines.
Coforge, Ather Energy, Zydus Lifesciences and Trent showed positive futures price-OI combinations. Wipro and Infosys, meanwhile, demonstrated that rising prices can also reflect declining outstanding positions.
The takeaway is not that a market decline is inevitable. It is that the Nifty’s positive close concealed considerable weakness across individual futures contracts.
For investors and traders, futures prices, OI changes, contract expiry, position size and verified corporate developments provide a more complete picture than benchmark movement alone.
Primary derivatives dataset: Supplied F&O end-of-day bhavcopy, FNO_BC30102026.DAT, trade date 30 October 2026. Analysis covers 218 November stock-futures contracts expiring 23 November 2026.
Read Next: Nikkei Slumps 3% as AI Payback Fears Hit Japan’s Chip Stocks
Disclaimer: This article is for informational and educational purposes only and does not constitute investment advice. Futures and options involve substantial risk. Open-interest classifications describe observed positioning and do not guarantee future price movements.