
Gold Surges 35% as Stocks Fall — But Long-Term Data Tells a Different Story
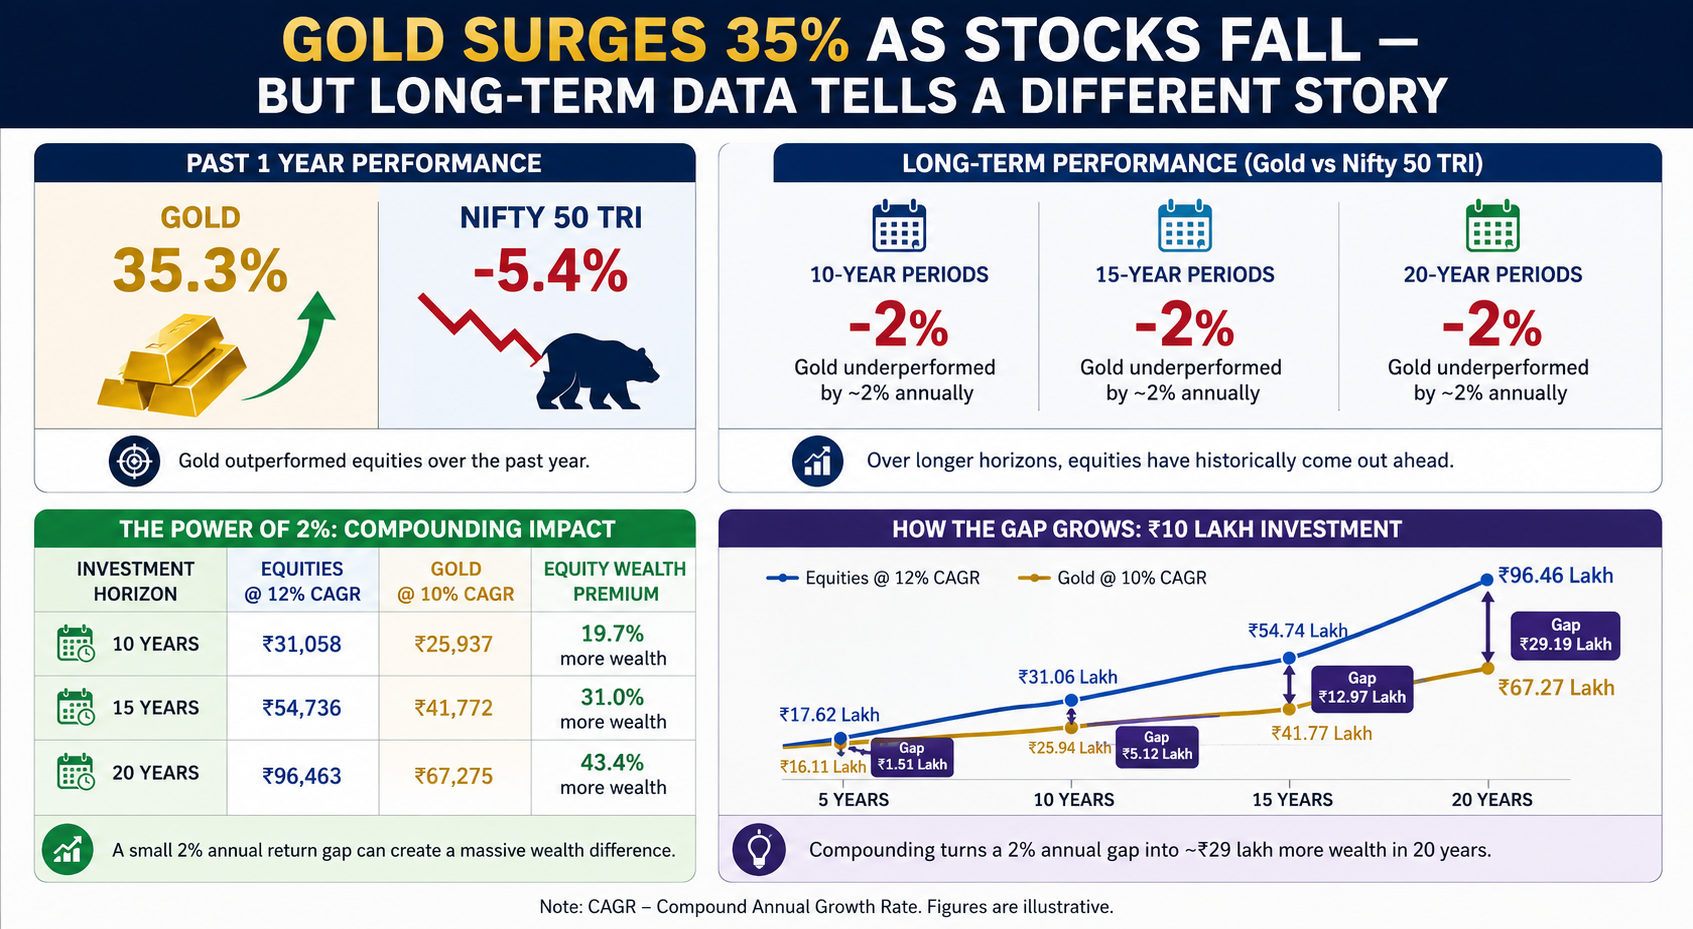
Gold has delivered the kind of return that can make investors rethink their portfolios. The yellow metal has gained 35.3% in the past year, while the Nifty 50 Total Return Index (TRI) has fallen 5.4%.
At first glance, the winner looks obvious.
But there is another side to the story. When the investment horizon stretches to 10, 15 or 20 years, the gold vs equities equation changes sharply.
Track Live : NSE Commodity Option Chain — Live MCX Options Data for Crude Oil, Gold, Silver & More
Gold Surges is the clear winner over the past year
The latest numbers show just how strongly gold has performed against Indian equities.
Gold: 35.3%
Nifty 50 TRI: -5.4%
That means gold has dramatically outperformed equities over the past year.
For investors looking at recent returns, gold may appear to be the more attractive asset. However, recent performance does not necessarily tell investors which asset is better for long-term wealth creation.
That is where the longer-term data becomes important.
Understanding Their Unique Roles
- Equities (Nifty 50 TRI): Optimized for long-term compounding and wealth creation. While volatile or negative in short-term stretches (like the past year’s -5.4%), the asset class leverages corporate earnings growth to outperform over decade-long horizons.
- Gold: Acts as a portfolio shock absorber and hedge. It excels during systemic economic distress, high inflation, or equity bear markets (evidenced by its recent +35.3% run), but does not generate operational cash flows to drive hyper-growth.
The Compounding Impact of the 2% Return Gap
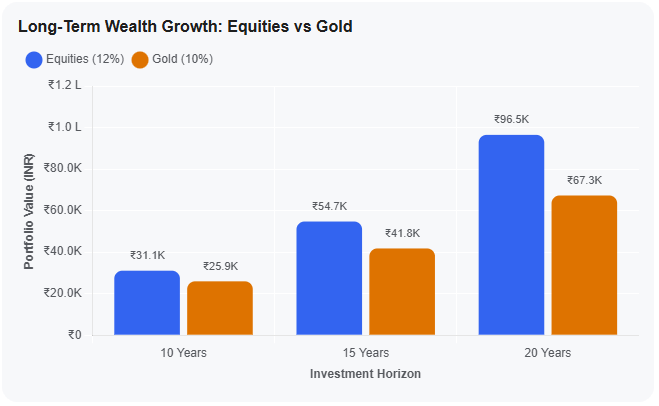
| Investment Horizon | Equities @ 12% CAGR | Gold @ 10% CAGR | Equity Wealth Premium |
|---|---|---|---|
| 10 Years | ₹31,058 | ₹25,937 | 19.7% more wealth |
| 15 Years | ₹54,736 | ₹41,772 | 31.0% more wealth |
| 20 Years | ₹96,463 | ₹67,275 | 43.4% more wealth |
Why a 2% Return Gap Matters Over the Long Term
A 2-percentage-point annual return gap may look small, but compounding can turn it into a substantial difference in wealth. FundsIndia’s research has found that gold has generally underperformed the Nifty 50 TRI by around 2–3 percentage points over 15–20-year periods.
For illustration, consider a ₹10 lakh investment:
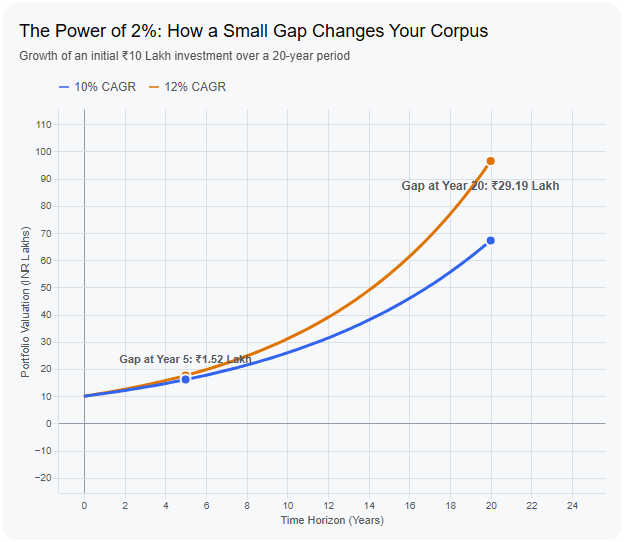
- After 5 years: 12% CAGR → ₹17.62 lakh vs 10% → ₹16.11 lakh — ₹1.51 lakh gap
- After 10 years: 12% → ₹31.06 lakh vs 10% → ₹25.94 lakh — ₹5.12 lakh gap
- After 15 years: 12% → ₹54.74 lakh vs 10% → ₹41.77 lakh — ₹12.97 lakh gap
- After 20 years: 12% → ₹96.46 lakh vs 10% → ₹67.27 lakh — ₹29.19 lakh gap
The important point is that the gap doesn’t grow linearly. Each year’s return gets added to the existing corpus, allowing subsequent returns to compound on a larger base.
So, while a 2-percentage-point difference may seem insignificant when looking at one year, over 20 years it can translate into nearly ₹29 lakh of additional wealth on an initial ₹10 lakh investment under these illustrative assumptions.
Gold vs equities looks very different over 10 years
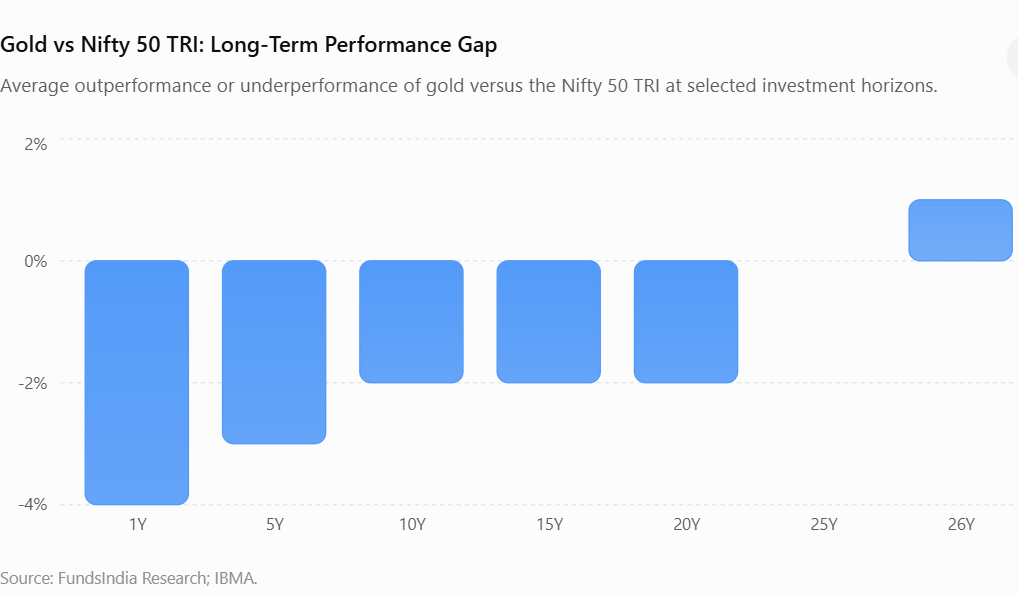
FundsIndia’s Wealth Conversations August 2026 report compared gold with the Nifty 50 TRI across different investment periods, beginning from January 2000.
The analysis measured gold’s annualised outperformance or underperformance against equities.
A positive number means gold performed better, while a negative number indicates that the Nifty 50 TRI delivered higher returns.
The results show that gold can outperform equities significantly over shorter periods, but the advantage becomes much less consistent as the holding period increases.
Read More : US Treasury Doubles Bond Buybacks as Debt, AI Spending and War Risks Rattle Markets
Long-term data shows equities generally come out ahead
The difference becomes clearer over longer investment horizons.
Across 10-year periods, gold underperformed the Nifty 50 TRI by around 2 percentage points annually on average, according to the FundsIndia report.
The pattern remained similar over 15-year periods, with gold again lagging equities by roughly 2 percentage points annually.
Over 20-year periods, gold continued to underperform the Nifty 50 TRI by around 2 percentage points annually on average.
That may sound like a small difference.
But compounding can make even a 2 percentage-point annual gap significant over several decades.
Strategic Portfolio Action Plan
-
- Establish Foundational Core: Never attempt to time the market based on a single year’s outlier performance. Avoid chasing gold after a massive 35% run.
- Implement Strategic Asset Allocation: Allocate 10% to 15% of your overall portfolio to gold to serve as insurance. Dedicate the remainder of your long-term capital to equities to maximize compounding.
- Systematic Rebalancing: When gold outperforms significantly (causing its portfolio weight to cross your target), trim profits from gold and reallocate to underperforming equities. This forces a disciplined mechanism to buy equities low and sell gold high.
Track Live : NSE Option Chain — Live
Gold can swing sharply against equities over shorter periods
Short-term performance tells a very different story.
For one-year holding periods, gold’s performance relative to equities varied dramatically depending on when the investment was made.
According to the FundsIndia analysis, gold’s relative performance ranged from an underperformance of as much as 65% to an outperformance of as much as 79%.
That wide range highlights one important point: asset-class leadership can change quickly.
The asset that performs best today may not remain the leader over the next investment cycle.
Here’s what happened today and why traders reacted
Gold’s 35.3% one-year gain stands out because Indian equities have struggled during the same period.
The sharp divergence has naturally attracted investor attention towards gold.
However, the FundsIndia data suggests that investors should be careful about extrapolating one year’s performance into the next decade.
Jiral Mehta, Senior Manager, Research at FundsIndia, said, “Leadership across asset classes keeps rotating, and no single one stays on top every year.”
That observation is particularly relevant after gold’s strong recent rally.
Why gold and equities play different roles
The gold vs equities debate is not simply about choosing the asset with the highest return.
Equities are generally considered a long-term wealth-creation asset. Businesses can grow earnings, revenues and profits over time, potentially creating substantial wealth for shareholders.
Gold serves a different purpose.
It can provide portfolio diversification and may perform strongly during periods of market stress, uncertainty or weak equity performance.
The past year illustrates that difference clearly.
While the Nifty 50 TRI delivered a negative return, gold gained more than 35%.
What does the gold rally mean for investors?
Gold’s recent performance may tempt investors to increase their allocation to the yellow metal.
But the long-term data provides a reason to remain balanced.
The historical numbers show that gold can deliver periods of powerful outperformance. However, over 10, 15 and 20-year periods, equities have generally generated higher annualised returns than gold.
For long-term investors, the bigger question is therefore not whether gold can beat equities for one year.
It is whether the asset fits the investor’s objective, risk tolerance and investment horizon.
Can gold beat equities over the long term?
Gold can certainly outperform equities during specific market cycles. The latest 35.3% gain is a strong example.
But the longer-term evidence from the FundsIndia analysis points in another direction.
Over 10, 15 and 20 years, gold has historically lagged the Nifty 50 TRI by around 2 percentage points annually on average.
For investors, the takeaway is not necessarily to choose gold over equities—or equities over gold.
Instead, the data highlights why gold and equities can serve different roles in a portfolio.
Gold can provide diversification and protection during difficult market phases, while equities remain an important vehicle for long-term wealth creation. The right allocation may therefore matter more than simply chasing whichever asset class is leading the return charts today.