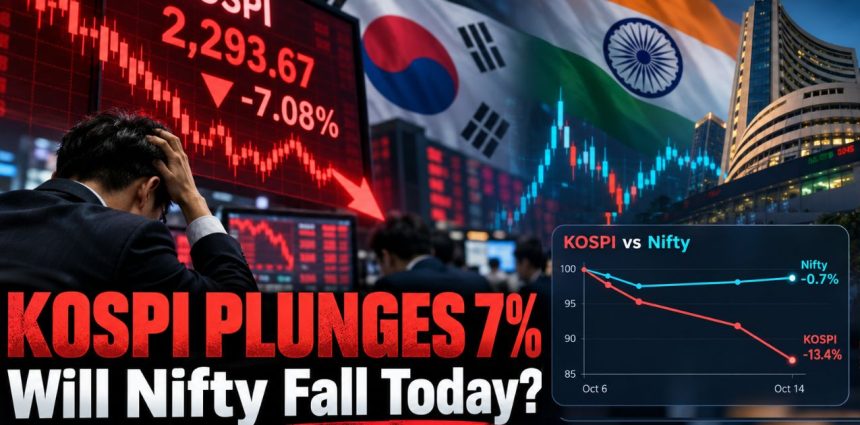
South Korea’s KOSPI plunged more than 7% at its intraday low on Thursday as hotter US inflation accelerated a global technology sell-off. But India’s early GIFT Nifty signal was far less negative. Can Nifty withstand the global pressure? Five key indicators may offer the answer.
South Korea’s KOSPI plunged more than 7% at its intraday low on October 15, as selling intensified across Asian technology stocks following stronger-than-expected US inflation data.
Japan’s Nikkei 225 also fell nearly 4% in early Thursday trading, while semiconductor and AI-related companies suffered some of the sharpest losses.
Yet India’s initial market signal told a different story.
GIFT Nifty was reported near 22,600, down just 0.10% in an early Thursday snapshot, despite the steep declines in South Korea and Japan.
The divergence raises an important question: Will the global sell-off trigger a deeper correction in Nifty and Sensex, or can domestic buying and India’s different sector composition help limit the impact?
A NiftyTrader analysis of recent index performance shows that Indian equities had already behaved very differently from Korean stocks before Thursday’s plunge.
Asian Market Sell-Off: Key Numbers at a Glance
| Market indicator | Reported figure |
|---|---|
| KOSPI | More than 7% lower at Thursday’s intraday low |
| Nikkei 225 | Down approximately 3.9% in early trade |
| US Nasdaq Composite | Fell approximately 1.9% on October 14 |
| US September CPI | 3.7% year-on-year |
| GIFT Nifty | Near 22,600, down approximately 0.10% in an early report |
| Nifty 50 | 22,622.70 at October 14 close |
| India VIX | Around 14.6 at October 14 close |
| FII cash activity | Net selling of ₹1,857.44 crore on October 14 |
| DII cash activity | Net buying of ₹2,670.44 crore on October 14 |
Market figures are from Reuters, Associated Press, the US Bureau of Labor Statistics and reported exchange data. Overseas intraday readings and the previous Indian-market close are different snapshots, not simultaneous observations. Prices may change during trading.
Track Live: GIFT NIFTY | NIFTY 50 | SENSEX | FII DII DATA
NiftyTrader Analysis: Korea Fell 13.44%, but Nifty Lost Just 0.67%
The most revealing comparison is what happened before the latest US inflation shock.
NiftyTrader compared the daily closing levels of South Korea’s KOSPI and India’s Nifty 50 between October 6 and October 14, 2026.
Both indices were rebased to 100 on October 6 to make their percentage performance comparable.
| Index | October 6 close | October 14 close | Change |
|---|---|---|---|
| KOSPI | 6,941.39 | 6,008.81 | −13.44% |
| Nifty 50 | 22,776.10 | 22,622.70 | −0.67% |
Source: Historical index closing prices. Percentage changes calculated by NiftyTrader.
The finding: The KOSPI declined nearly 13.5% during this period, while Nifty lost less than 1%.
This does not mean Indian equities are immune to global market weakness. It does, however, demonstrate that the two markets were responding differently to the prevailing risks.
The divergence is partly explained by their sector composition.
South Korea’s benchmark has heavy exposure to major semiconductor manufacturers, including Samsung Electronics and SK Hynix. These companies are sensitive to changes in global chip demand, artificial intelligence investment and technology valuations.
India’s Nifty 50 has a more diversified sector composition, including financial services, energy, information technology, consumer businesses and industrial companies.
The KOSPI’s Thursday intraday low of 5,584.83 also placed it approximately 20.26% below its October 2 close of 7,003.74, according to NiftyTrader’s calculation.
That is a substantial correction over a short period, but it does not establish that India’s benchmark must experience a similar decline.
The October 6–14 comparison excludes Thursday’s fresh KOSPI fall because Indian markets had not opened when this pre-market analysis was prepared.
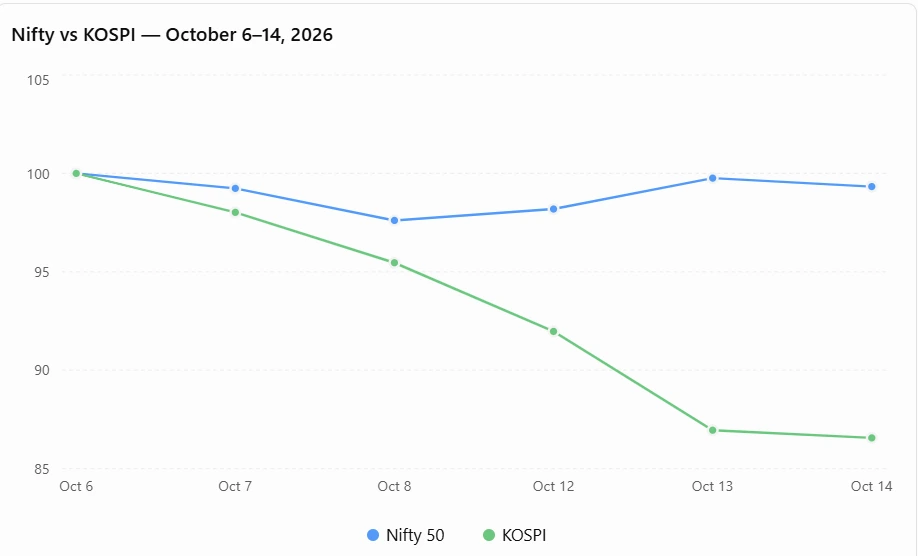
Both indices rebased to 100 on October 6, using matching daily closes through October 14. Historical data: Yahoo Finance and Investing.com. Calculations by NiftyTrader.
The historical comparison is based on published index closing data. The CPI figures, KOSPI intraday sell-off, institutional flows and earnings dates were checked against the relevant releases and reporting.
Why Did US CPI Trigger the Global Market Sell-Off?
The global selling followed a hotter-than-expected US inflation report released on October 14.
According to the US Bureau of Labor Statistics:
- US headline inflation accelerated to 3.7% year-on-year in September, compared with 3.4% in August.
- Consumer prices rose 0.6% month-on-month.
- Core inflation increased 0.3% month-on-month and reached 2.6% annually.
Gasoline prices increased 9.1% during September, accounting for more than half of the monthly headline inflation increase.
The report increased market expectations that the US Federal Reserve could raise interest rates further.
Higher borrowing costs can make financing more expensive and reduce the valuations investors are willing to pay for companies whose expected profits lie further in the future.
That is particularly relevant to AI infrastructure businesses, which often require substantial investment in data centres, computing equipment and financing.
The technology sell-off was evident in Asia.
Associated Press reported Samsung Electronics falling 8.2% and SK Hynix dropping 10.8% during the Korean market slide.
The important distinction for investors is that falling AI-related share prices do not necessarily mean AI demand has collapsed. Financing concerns, valuations and business fundamentals can move in different directions.
Five Signals That Could Decide Nifty’s Reaction Today
For Indian traders, the size of the KOSPI decline is only the starting point.
The more useful approach is to monitor indicators that show whether overseas selling pressure is reaching India’s financial markets.
1. GIFT Nifty: Is India’s Pre-Market Weakness Increasing?
An early Thursday report placed GIFT Nifty near 22,600, around 0.10% lower.
That was a much smaller percentage move than the contemporaneously reported Asian technology sell-off, although the instruments and observation times differed.
What traders should watch: Whether GIFT Nifty weakness increases before 9:15 AM IST and whether the actual Nifty 50 opening confirms the negative sentiment.
GIFT Nifty should be treated as a pre-market indication, not a guaranteed opening forecast.
Track the latest GIFT Nifty data on NiftyTrader.
2. FII-DII Activity: Domestic Investors Are Absorbing Some Selling
Foreign institutional investors have remained net sellers in Indian equities, adding to concerns about the market’s ability to withstand external shocks.
But the latest reported institutional data also provides an important counterpoint.
On October 14:
- FII/FPI cash-market net activity: −₹1,857.44 crore
- DII cash-market net activity: +₹2,670.44 crore
Domestic institutional net buying exceeded foreign institutional net selling by ₹813 crore that day.
This is a NiftyTrader calculation using the reported cash-market figures, not a measure of total market demand.
It demonstrates why foreign selling alone is not sufficient to predict the Nifty’s direction.
What traders should watch: Whether DII buying continues to offset foreign selling, and whether that institutional activity is accompanied by improving market breadth and price action.
Explore FII-DII data and institutional positioning.
3. India VIX: Is the Options Market Confirming Global Fear?
India VIX is particularly relevant to Nifty options traders because it represents the market’s expectation of near-term volatility derived from index option prices.
On October 14, India VIX closed around 14.6, approximately 3.5% above its previous closing level, according to historical market-data providers.
That increase occurred before the latest Thursday Asian sell-off.
The reading shows that Indian options-market volatility expectations had already risen, although the absolute level by itself does not establish extreme market stress.
What traders should watch: Whether India VIX rises further alongside Nifty weakness, and whether option premiums, open interest and market breadth confirm a broader change in risk sentiment.
A rise in India VIX does not guarantee a fall in the Nifty, but it can materially affect option pricing.
Track India VIX levels and expected ranges.
4. Nifty IT: Will Global Technology Weakness Spread to Indian Stocks?
Indian IT stocks are another important area to monitor.
However, the relationship between US AI infrastructure companies and Indian IT service providers is not straightforward.
Indian IT companies depend significantly on enterprise technology budgets, contract renewals, project spending and operating margins.
Their exposure differs from semiconductor manufacturers and businesses financing large AI infrastructure projects.
Interestingly, the Nifty IT index gained approximately 1.1% on October 14 even as the broader Nifty declined 0.44%.
That relative strength shows why investors should avoid assuming that all technology-related stocks will respond identically to the global AI sell-off.
What traders should watch: Nifty IT performance relative to Nifty 50, quarterly earnings and management commentary on AI adoption and client spending.
5. Crude Oil and the Rupee: Could Global Pressure Spread Beyond IT?
The Indian market also faces risks unrelated to semiconductor valuations.
Brent crude was trading around $105 per barrel in early Thursday reporting, reflecting continued pressure from geopolitical developments and energy supply concerns.
Higher crude prices can increase India’s import costs and complicate inflation expectations.
At the same time, stronger US interest-rate expectations can influence currency movements and emerging-market capital flows.
What traders should watch: Brent crude, USD/INR, US Treasury yields and institutional flows together.
If several indicators deteriorate simultaneously, the pressure on Indian equities may extend beyond technology stocks.
Wipro and Tech Mahindra Earnings Add an India-Specific Trigger
Indian IT earnings provide another reason not to judge Thursday’s market outlook solely by overseas headlines.
Wipro has scheduled its September-quarter results for October 15, after Indian market hours.
Tech Mahindra also has an October 15 financial-results board meeting and earnings-related event scheduled.
Investors will focus on revenue growth, operating margins, large-deal momentum, client spending and management guidance.
Given the weakness in overseas technology shares, commentary about AI spending and its effect on IT services demand may attract additional attention.
The earnings could provide company-specific reasons for Indian IT shares to either withstand or follow the global technology sell-off.
Three Possible Nifty Scenarios After the KOSPI Plunge
The next move in Indian equities will depend on how global uncertainty interacts with domestic trading.
| Scenario | What would support it |
|---|---|
| Relative resilience | Stable India VIX, sustained DII demand and improving market breadth |
| Sector-specific selling | Nifty IT and other technology-linked stocks weaken while broader sectors remain comparatively steady |
| Broader risk-off pressure | Rising India VIX, widespread selling, rupee weakness and persistent foreign outflows |
These scenarios are possible interpretations of market conditions, not forecasts or trading recommendations.
For traders, the key is whether domestic indicators independently confirm the overseas weakness.
What Could Change the Market Outlook Next?
The next developments worth monitoring include:
TSMC Q3 earnings: Taiwan Semiconductor Manufacturing Company is scheduled to hold its third-quarter earnings conference on October 15 at 11:30 AM IST. Its outlook may offer a useful perspective on demand for AI-related chips.
US economic data: Producer-price and retail-sales data, along with further Federal Reserve communication, could alter interest-rate expectations.
Federal Reserve meeting: The next scheduled policy meeting is October 27–28. Market expectations may change before the decision.
Indian earnings and institutional flows: Domestic corporate results, crude prices and the actual Nifty market response will determine whether the global technology sell-off translates into a broader Indian market decline.
Bottom Line: Does the KOSPI Crash Mean Nifty Will Fall?
Not necessarily.
South Korea’s KOSPI has experienced a substantial correction driven partly by semiconductor and AI-related concerns, while the Nifty 50 had demonstrated much smaller losses over the preceding October 6–14 period.
The latest US inflation report has increased uncertainty over interest rates and global growth-stock valuations.
But India’s market direction depends on more than the performance of one overseas index.
For October 15, the five indicators worth watching are GIFT Nifty, FII-DII flows, India VIX, Nifty IT and crude oil.
If domestic volatility remains contained and institutional demand supports the market, India may continue to behave differently from the Korean technology-heavy benchmark.
If global pressure is confirmed by rising volatility, deteriorating breadth and sustained selling, the downside risks may broaden.
The distinction will become clearer once actual Indian trading begins.
Read Next: Jio IPO RHP: ₹30,049 Crore Profit, but Return on Capital Falls
Frequently Asked Questions
Why did the KOSPI fall more than 7% on October 15?
A technology-led global market sell-off intensified after US inflation rose faster than expected. Heavy declines in Samsung Electronics and SK Hynix contributed to the KOSPI’s sharp intraday fall.
Will the Nifty crash because the KOSPI is falling?
A KOSPI decline does not automatically imply an equivalent Nifty decline. India’s market has different sector exposures, institutional flows and domestic earnings drivers.
How does US CPI affect the Indian stock market?
US inflation influences expectations for Federal Reserve policy, bond yields, currency movements and international investment flows. These factors can affect Indian equities indirectly.
How can traders assess whether global selling is affecting Nifty?
They can monitor actual Nifty price action, market breadth, India VIX, FII-DII activity, currency movements and the performance of important sectors rather than relying on a single global indicator.
Disclaimer: This article is for informational and educational purposes only and does not constitute investment advice. Market data represents the stated reporting periods and may change. Trading and investing in securities and derivatives involve market risk.