
IDBI Bank Q2 FY27 Results reveal a profit decline with a strong underlying performance
IDBI Bank’s September-quarter earnings appear weaker at first glance, but the headline profit decline does not tell the full story. A one-time gain recorded last year inflated the comparison, while stronger interest income, improving margins and lower bad-loan ratios supported the bank’s latest performance.
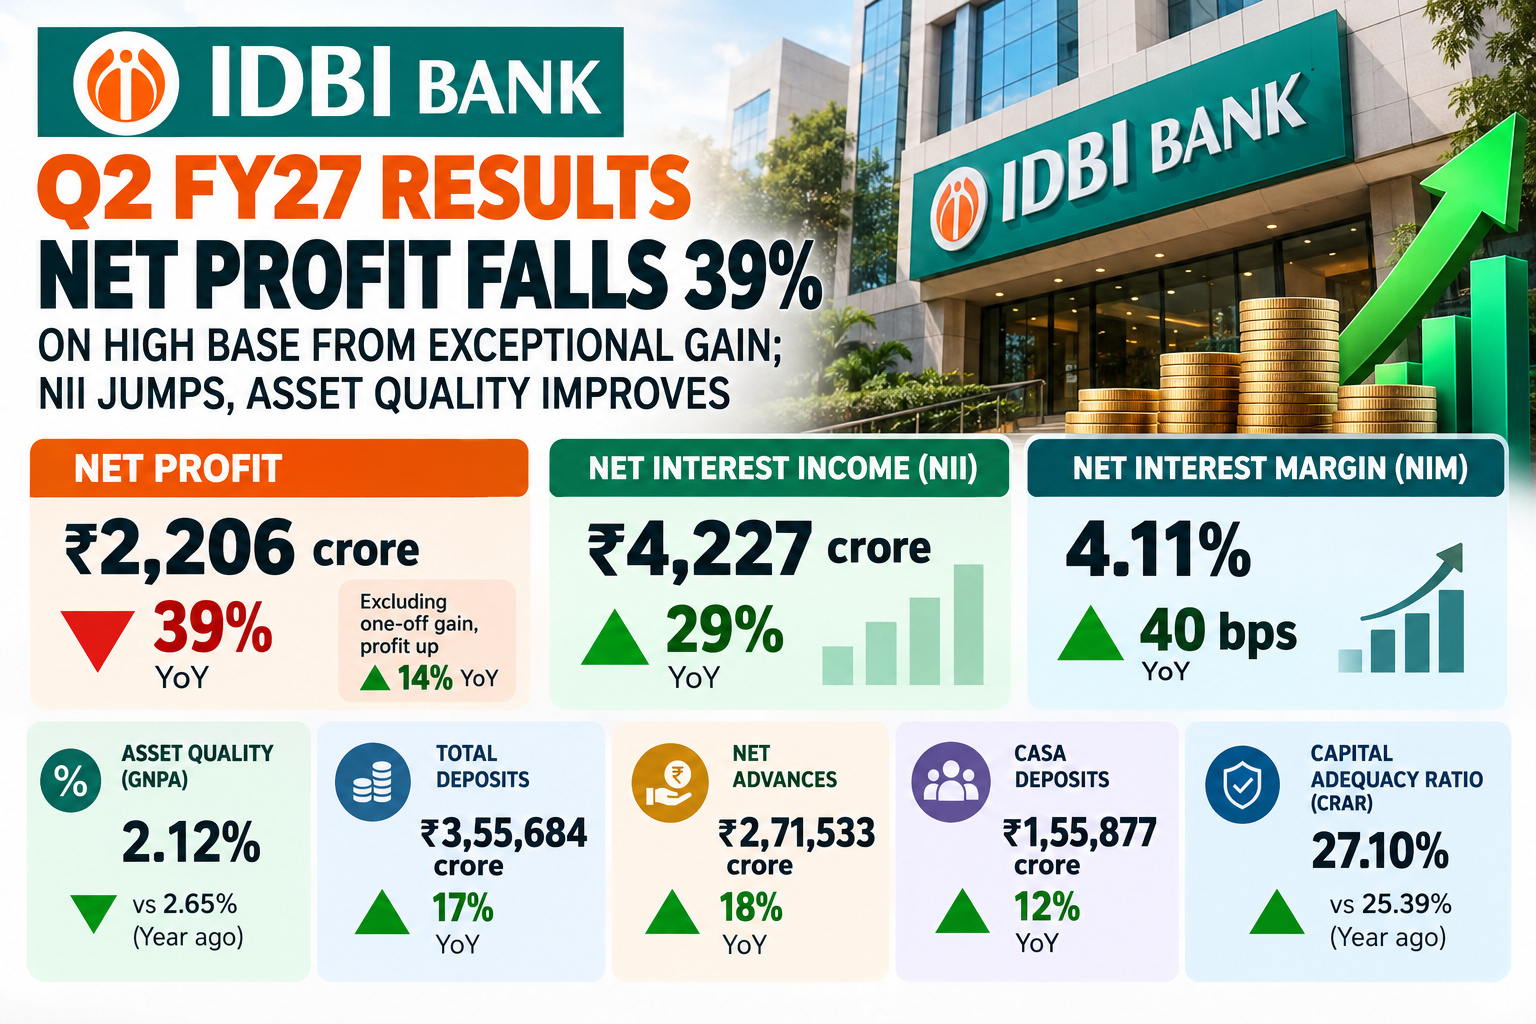
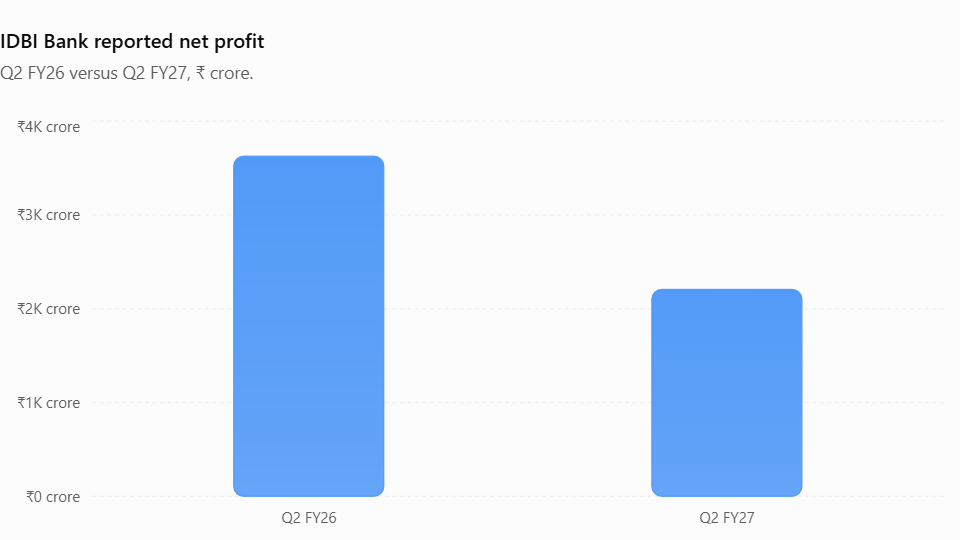
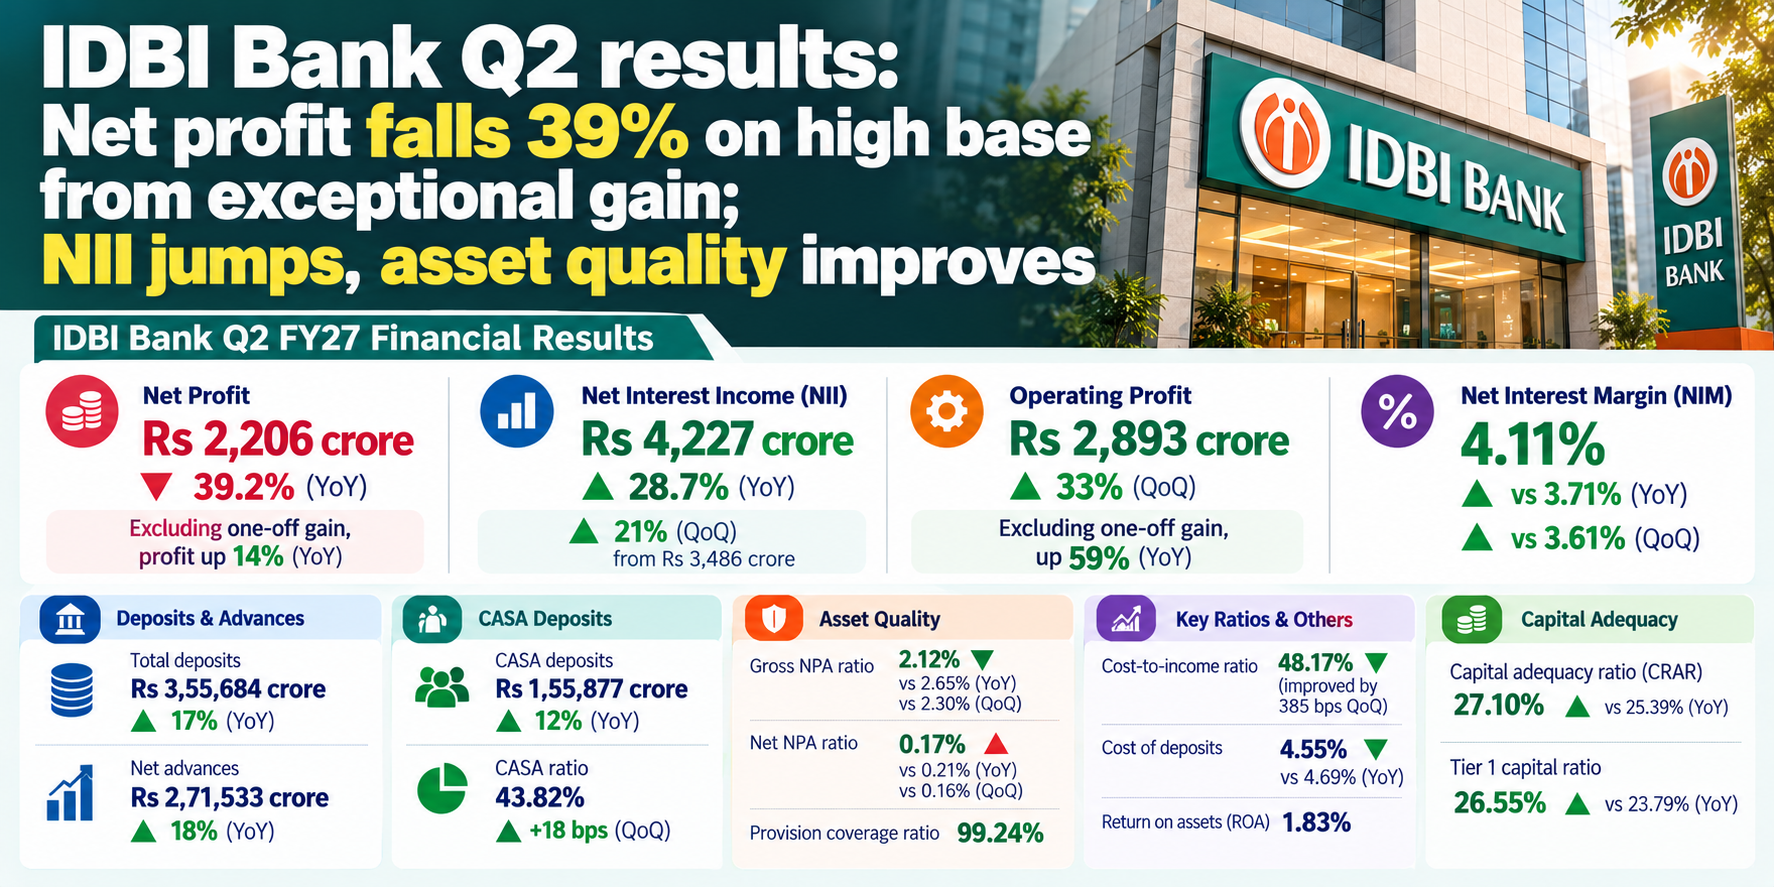
The lender reported net profit of Rs 2,206 crore for Q2 FY27, down 39.2% from Rs 3,627 crore a year earlier. However, excluding the exceptional gain from the previous year, IDBI Bank said its net profit increased 14% year-on-year.
Profit also rose around 4% sequentially from Rs 2,115 crore in the June quarter.
Track Live : NSE Option Chain — Live | BSE Option Chain — Live Sensex & Bankex Options Data Today
IDBI Bank Q2 FY27 Results NII Jumps 28.7% as Net Interest Margin Improves
Net interest income (NII), the difference between interest earned and interest paid, increased 28.7% year-on-year to Rs 4,227 crore from Rs 3,285 crore. Sequentially, NII rose approximately 21% from Rs 3,486 crore.
The bank’s net interest margin (NIM) expanded to 4.11% from 3.71% a year earlier and 3.61% in the previous quarter. This improvement indicates stronger income generation from the bank’s interest-earning assets relative to its funding costs.
Operating profit stood at Rs 2,893 crore. Excluding the previous year’s exceptional NSDL gain, operating profit grew 59% year-on-year.
The cost-to-income ratio improved to 48.17%, down 385 basis points sequentially. The cost of deposits also eased to 4.55% from 4.69% a year earlier, supporting the bank’s core earnings performance.
Key financial numbers at a glance
| Financial metric | Q2 FY27 figure | Comparison |
|---|---|---|
| Net profit | ₹2,206 crore | −39.2% YoY |
| Profit excluding prior-year exceptional gain | — | +14% YoY, as reported by the bank |
| Net interest income (NII) | ₹4,227 crore | +28.7% YoY |
| Net interest margin (NIM) | 4.11% | Up from 3.71% a year earlier |
| Operating profit | ₹2,893 crore | +59% YoY excluding prior-year NSDL gain |
| Gross NPA ratio | 2.12% | Down from 2.65% a year earlier |
| Net NPA ratio | 0.17% | Down from 0.21% a year earlier |
| Capital adequacy ratio | 27.10% | Up from 25.39% a year earlier |
Why did net profit fall 39.2%?
Reported net profit declined from ₹3,627 crore in Q2 FY26 to ₹2,206 crore in Q2 FY27. The main reason was the absence of a ₹1,699 crore exceptional gain recorded in the previous year from the sale of a strategic investment in NSDL.
| Profit comparison | Amount |
|---|---|
| Q2 FY26 reported profit | ₹3,627 crore |
| Q2 FY27 reported profit | ₹2,206 crore |
| Absolute decline | ₹1,421 crore |
| Reported year-on-year change | −39.2% |
| Exceptional gain in Q2 FY26 | ₹1,699 crore |
| Profit growth excluding that gain | +14%, as reported by the bank |
Net interest income jumped 28.7%
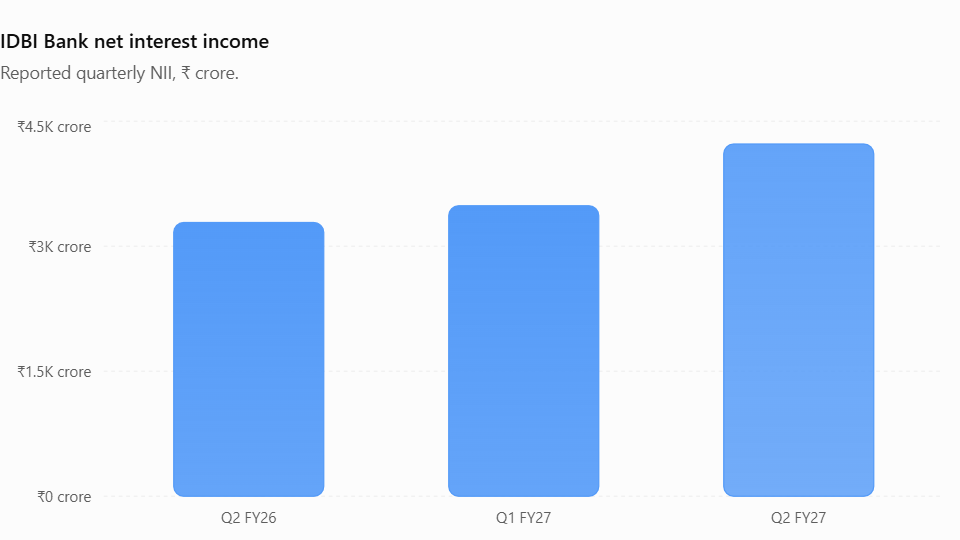
Net interest income increased to ₹4,227 crore from ₹3,285 crore a year earlier. It also rose approximately 21% sequentially from ₹3,486 crore in Q1 FY27.
| NII comparison | Amount |
|---|---|
| Q2 FY26 | ₹3,285 crore |
| Q1 FY27 | ₹3,486 crore |
| Q2 FY27 | ₹4,227 crore |
| Year-on-year growth | +28.7% |
| Quarter-on-quarter growth | Approximately +21.3% |
NII is the difference between interest earned on loans and investments and interest paid on deposits and borrowings.
Net interest margin improved to 4.11%
IDBI Bank’s NIM increased to 4.11% in Q2 FY27 from 3.71% a year earlier and 3.61% in Q1 FY27.
| Period | Net interest margin |
|---|---|
| Q2 FY26 | 3.71% |
| Q1 FY27 | 3.61% |
| Q2 FY27 | 4.11% |
| Year-on-year change | +40 basis points |
| Quarter-on-quarter change | +50 basis points |
A basis point is one-hundredth of a percentage point. Therefore, a 50-basis-point increase represents a rise of 0.50 percentage points.
Operating profit increased, while cost efficiency improved
Operating profit stood at ₹2,893 crore. The bank reported sequential growth of 33% and year-on-year growth of 59% after excluding the prior-year NSDL gain. Its cost-to-income ratio declined to 48.17%, an improvement of 385 basis points sequentially.
| Operating indicator | Q2 FY27 | Reported comparison |
|---|---|---|
| Operating profit | ₹2,893 crore | +33% QoQ |
| Adjusted operating profit growth | — | +59% YoY, excluding prior-year NSDL gain |
| Cost-to-income ratio | 48.17% | Improved by 385 bps QoQ |
| Cost of deposits | 4.55% | Down from 4.69% a year earlier |
The cost-to-income ratio measures operating expenses relative to operating income. A lower ratio generally indicates improved operating efficiency.
The reduction suggests that IDBI Bank generated more operating income relative to its costs than in the preceding quarter. Lower deposit costs may also have helped support interest margins.
Asset quality improves as IDBI Bank’s gross NPA declines
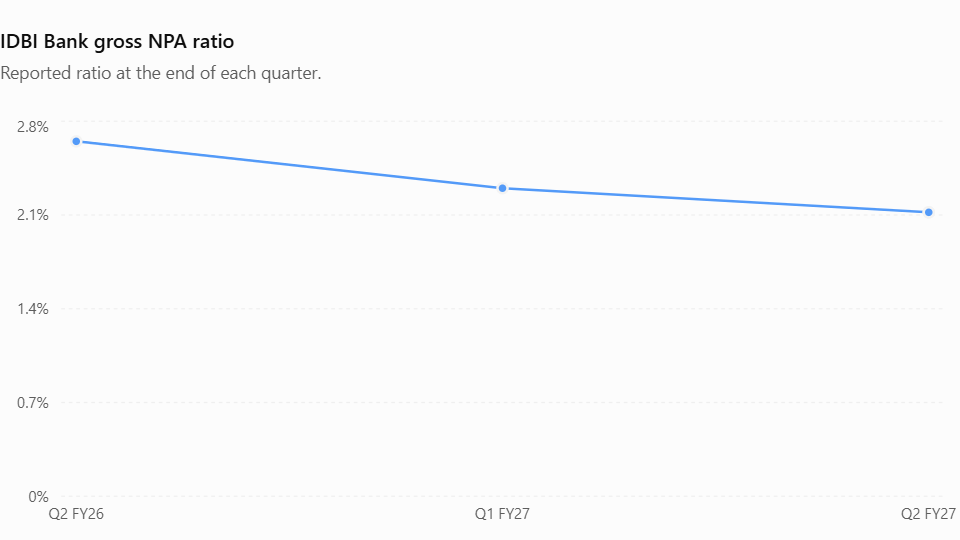
IDBI Bank reported an improvement in its gross non-performing asset (GNPA) ratio, which declined to 2.12% at the end of September from 2.30% in June and 2.65% a year earlier.
The net NPA ratio, however, edged up slightly to 0.17% from 0.16% in the previous quarter. It remained below the year-ago level of 0.21%.
The bank’s provision coverage ratio, including technical write-offs, stood at 99.24%. This high coverage provides an important measure of protection against identified bad loans.
For investors, the improvement in gross asset quality is encouraging, although the slight sequential increase in the net NPA ratio deserves attention in future results.
| Asset-quality metric | Q2 FY27 | Previous comparison |
|---|---|---|
| Gross NPA ratio | 2.12% | 2.30% in Q1 FY27; 2.65% a year earlier |
| Net NPA ratio | 0.17% | 0.16% in Q1 FY27; 0.21% a year earlier |
| Provision coverage ratio, including technical write-offs | 99.24% | At September end |
The gross NPA ratio improved by 18 basis points sequentially and 53 basis points year on year.
The net NPA ratio, meanwhile, increased by one basis point from the June quarter, although it remained below the year-earlier level.
Track Live : Nifty Levels Today | Sensex Levels Today
Deposits and advances registered double-digit growth
IDBI Bank reported growth in both deposits and advances, indicating an expansion of its funding base and lending activity.
| Business metric | Q2 FY27 | YoY growth |
|---|---|---|
| Total deposits | ₹3,55,684 crore | +17% |
| Net advances | ₹2,71,533 crore | +18% |
| CASA deposits | ₹1,55,877 crore | +12% |
| CASA ratio | 43.82% | Improved 18 bps sequentially |
What does the CASA ratio tell us?
CASA stands for current account and savings account deposits. These deposits can provide banks with a relatively low-cost source of funding compared with certain term deposits.
IDBI Bank’s CASA deposits grew 12% year on year, and the CASA ratio improved by 18 basis points sequentially to 43.82%.
Capital adequacy strengthened
IDBI Bank reported a capital adequacy ratio of 27.10%, up from 25.39% a year earlier. Its Tier 1 capital ratio also increased.
| Capital metric | September 2026 | September 2025 |
|---|---|---|
| Capital adequacy ratio (CRAR) | 27.10% | 25.39% |
| Tier 1 capital ratio | 26.55% | 23.79% |
| Return on assets (RoA) | 1.83% | — |
A higher capital adequacy ratio indicates a larger capital buffer relative to risk-weighted assets. Tier 1 capital is a core component of regulatory capital.
The reported improvement gives the bank a stronger capital position than a year earlier. However, the ratio should be assessed alongside the bank’s future lending growth, risk-weighted assets, profitability and regulatory requirements.
Return on assets of 1.83% provides another measure of profitability, indicating the earnings generated relative to the bank’s asset base.
Deposits and advances grow as IDBI Bank expands its business
Total deposits increased 17% year-on-year to Rs 3,55,684 crore, while net advances grew 18% to Rs 2,71,533 crore. On a sequential basis, deposits rose 9% and net advances increased 5%.
Current account and savings account (CASA) deposits grew 12% to Rs 1,55,877 crore. The CASA ratio improved by 18 basis points sequentially to 43.82%.
Capital adequacy also strengthened. The capital adequacy ratio rose to 27.10% from 25.39% a year earlier, while the Tier 1 capital ratio increased to 26.55% from 23.79%. Return on assets stood at 1.83% for the quarter.
Read More : Central Bank of India Q2 FY27 Results: Advances Jump Nearly 30%, But Who Is Funding the Growth?
IDBI Bank–Fairfax deal: Why it matters
The quarterly results came shortly after the Union Cabinet approved the strategic sale of a 60.72% stake in IDBI Bank to Canada’s Fairfax Financial Holdings for approximately ₹52,878 crore, at ₹81 per share. The transaction involves stakes held by the central government and Life Insurance Corporation of India (LIC).
Stake approved for sale 60.72%
Deal value ₹52,878 cr
Acquisition price ₹81/share
Friday closing price ₹84.12
The Cabinet’s approval is a transaction milestone; completion remains subject to applicable regulatory and transaction requirements.
What does the deal mean?
-
Ownership change: Fairfax is set to acquire a controlling stake, subject to completion of the transaction.
-
Potential strategic changes: A new controlling shareholder could influence the bank’s business priorities, governance and long-term growth strategy.
-
Valuation considerations: The ₹81 acquisition price provides a reference point for the transaction, but it does not establish the bank’s fair market value or guarantee the future share price.
-
Execution risks: Regulatory approvals, transaction completion and any future strategic changes will matter to shareholders.
IDBI Bank share price and market performance
According to your report, IDBI Bank shares closed at ₹84.12 on Friday, October 16, after falling 7.7% on Thursday following the Cabinet’s announcement.
| Stock market metric | Figure |
|---|---|
| Closing share price | ₹84.12 |
| Fairfax acquisition price | ₹81 per share |
| Year-to-date stock return | −19% |
| Nifty 50 year-to-date return | −11.5% |
| Market capitalisation | Approximately ₹90,449 crore |
Overall assessment of IDBI Bank Q2 FY27 results
| Area | Key finding | Interpretation |
|---|---|---|
| Reported net profit | ₹2,206 crore, down 39.2% | Affected by the prior-year exceptional gain |
| Adjusted profit growth | +14%, as reported by the bank | Underlying comparison was stronger |
| NII | ₹4,227 crore, up 28.7% | Strong core interest income |
| NIM | 4.11% | Improved year on year and sequentially |
| Operating profit | ₹2,893 crore | Higher after adjusting for the prior-year gain |
| Gross NPA ratio | 2.12% | Improved from 2.30% in June |
| Net NPA ratio | 0.17% | Slight sequential increase, but below year-earlier level |
| Deposits | ₹3,55,684 crore, up 17% | Expanded funding base |
| Net advances | ₹2,71,533 crore, up 18% | Continued lending growth |
| Capital adequacy | 27.10% | Higher than a year earlier |
| Fairfax transaction | 60.72% stake approved for sale | Potentially significant ownership transition |