
SBI Q2 FY27 Results Date: Why November 3 Is Important for Investors
State Bank of India (SBI) investors are approaching an important earnings trigger as the country’s largest public sector lender prepares to announce its September quarter results. The key question is whether SBI can maintain its record-breaking profitability or whether pressure on interest margins and treasury income will moderate its earnings growth.
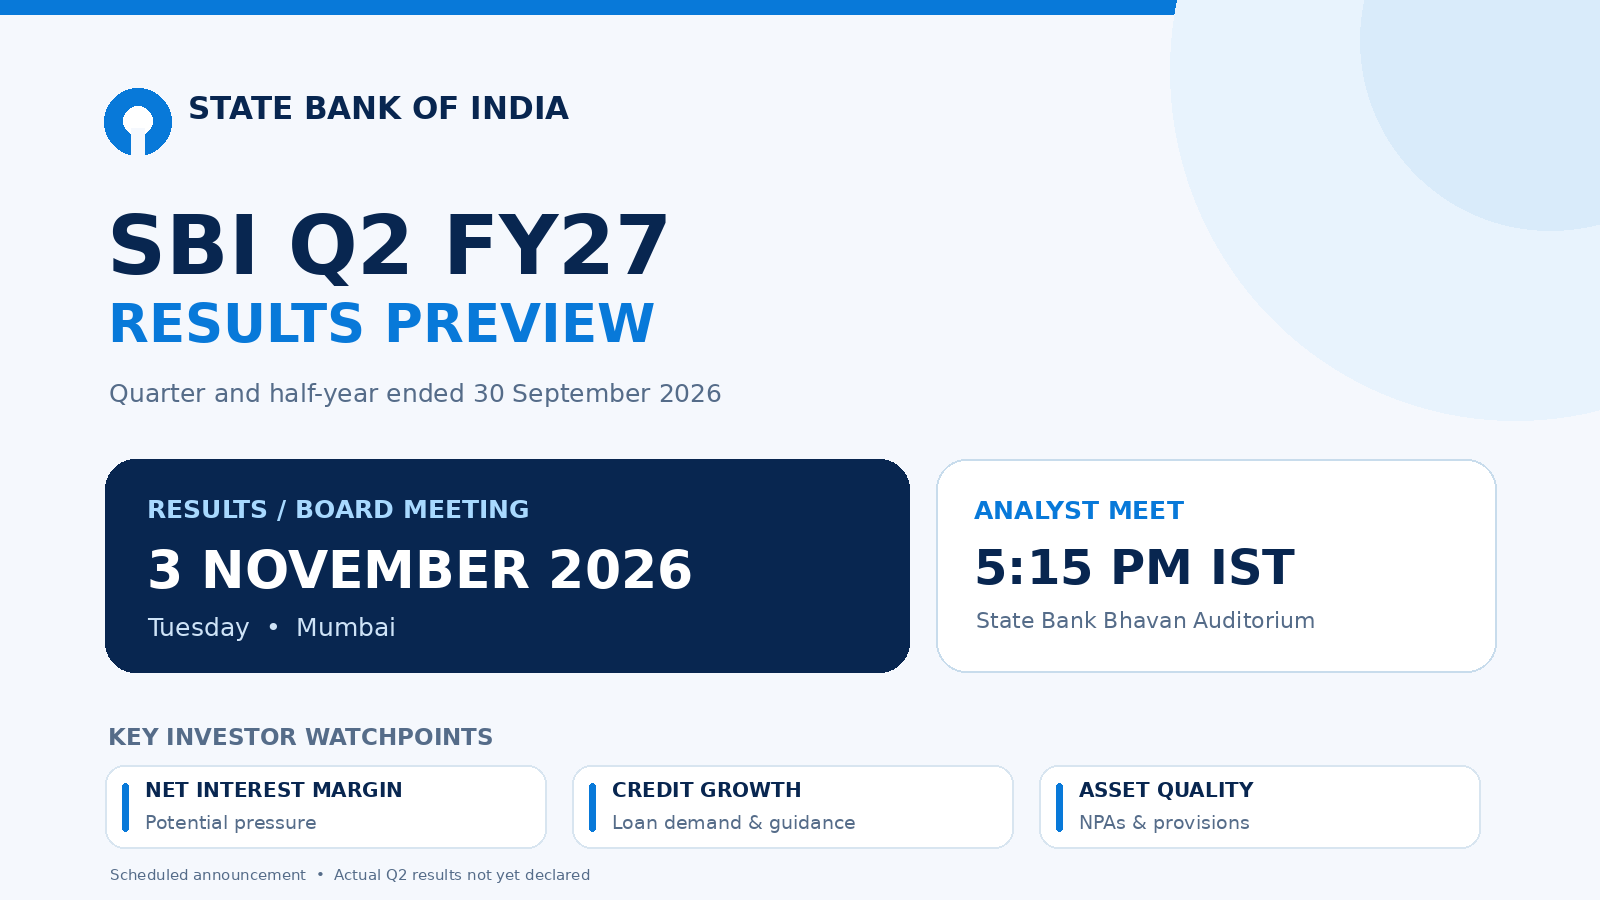
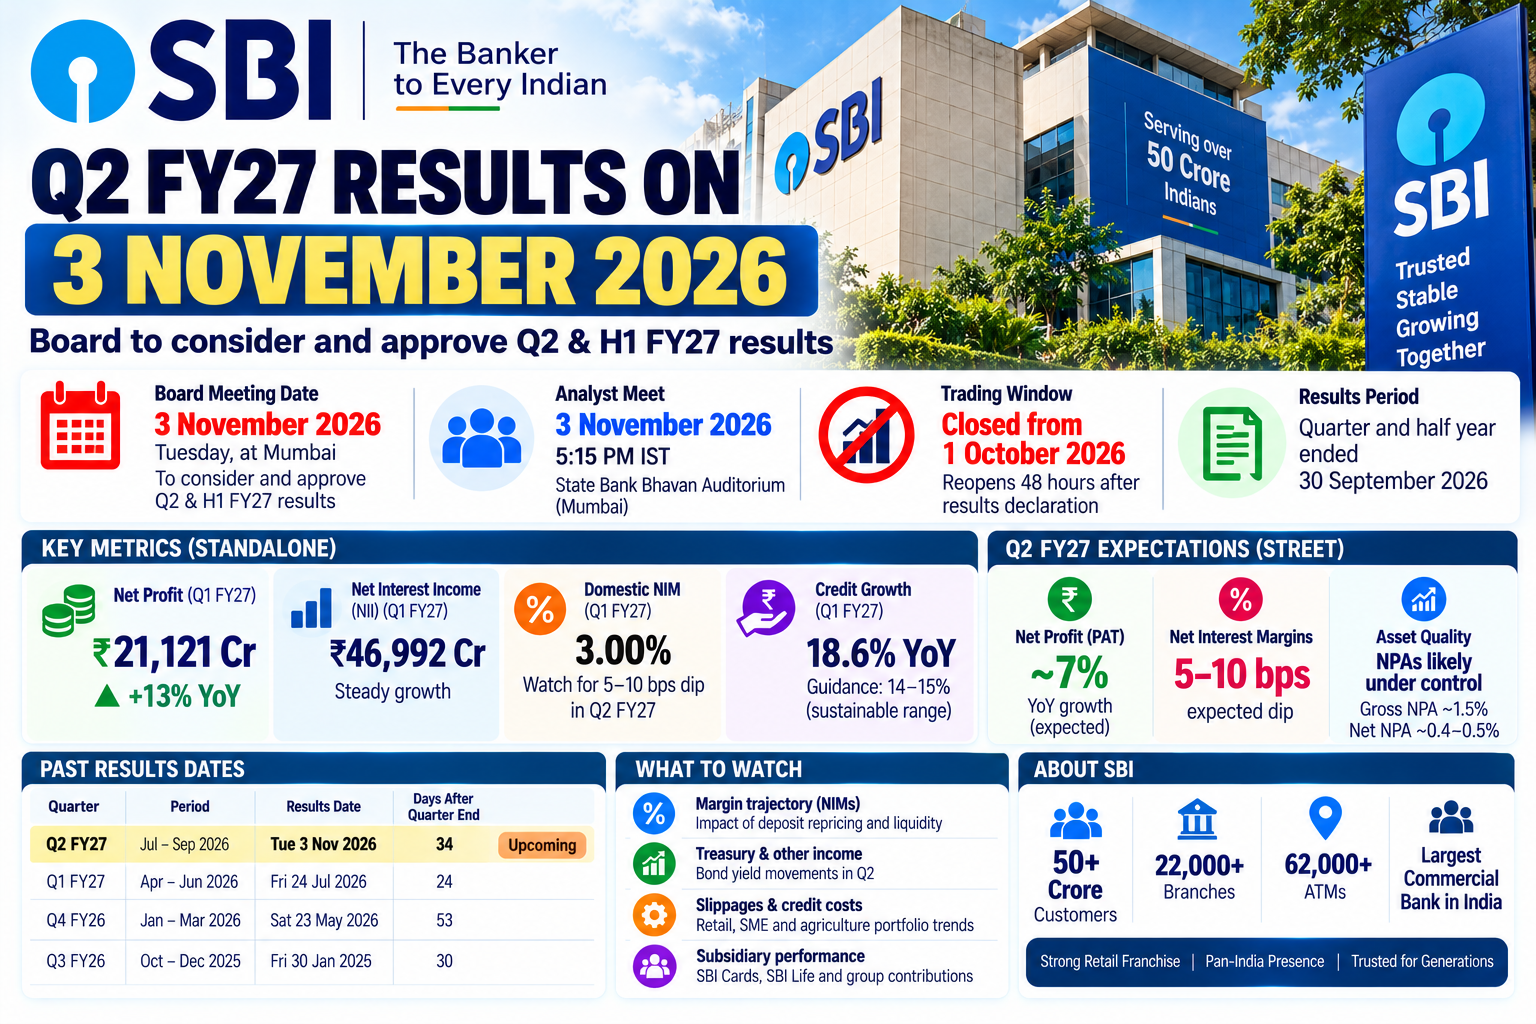
SBI has scheduled its Central Board meeting for Tuesday, November 3, 2026, in Mumbai to consider and approve the financial results for the quarter and half-year ended September 30, 2026.
The bank will also organise an analyst meeting at 5:15 PM IST at the State Bank Bhavan Auditorium, after the Q2 FY27 results are declared. Investors will closely monitor management commentary for clues about future profitability, loan growth and asset quality.
Track Live : Results Calendar — NSE & BSE
SBI Q2 FY27 Results: Board Meeting, Analyst Meet and Trading Window Details
The bank has communicated the schedule under Regulations 29 and 50 of the SEBI (Listing Obligations and Disclosure Requirements) Regulations, 2015.
Important details include:
- Board Meeting: Tuesday, November 3, 2026.
- Results Period: Q2 and H1 FY27, ended September 30, 2026.
- Analyst Meeting: November 3 at 5:15 PM IST.
- Venue: State Bank Bhavan Auditorium, Mumbai.
- Trading Window: Closed since October 1, 2026.
- Reopening: 48 hours after the financial results are declared.
The trading window restriction applies to designated persons and their immediate relatives or dependents under the bank’s insider trading code.
Track Live : NSE Option Chain — Live | BSE Option Chain — Live Sensex & Bankex Options Data Today
SBI Q2 FY27 Profit Expectations: Can the Bank Beat Its Previous Performance?
SBI enters the September quarter with a strong earnings base. The bank reported standalone net profit of ₹21,121 crore in Q1 FY27, marking a record performance.
In comparison, SBI reported standalone net profit of ₹20,160 crore in Q2 FY26. However, the previous year’s September quarter included a ₹4,593 crore gain from the sale of its Yes Bank stake, making the year-on-year comparison important.
Market expectations suggest relatively modest profit growth, with some brokerage estimates pointing towards approximately 7% growth. Other early estimates indicate a broadly stable performance or a slight decline, depending on provisions and treasury income.
Investors should therefore focus on core operating profitability rather than headline net profit alone.
SBI’s Q1 FY27 operating performance provides a stronger comparison
According to Reuters’ August 7 results report, SBI delivered:
| Metric | Q1 FY27 performance |
|---|---|
| Net profit | ₹21,121 crore |
| Net interest income | ₹46,992 crore |
| NII growth YoY | 14.88% |
| Gross advances growth | 18.63% |
| Deposit growth | 9.73% |
| Domestic NIM | 3.00% |
| Gross NPA | 1.47% |
| Net NPA | 0.38% |
The bank’s profit increased 10.2% year-on-year, exceeding analysts’ expectations.
Track Live : Nifty Levels Today | Sensex Levels Today
SBI Net Interest Margin Outlook and Loan Growth Will Remain Key Triggers
Net interest margins (NIMs) will be among the most closely watched indicators in SBI’s Q2 FY27 results.
The bank reported a domestic NIM of 3.00% in Q1 FY27. Analysts expect a modest contraction of approximately 5–10 basis points in Q2, potentially reflecting liquidity conditions, FCNR(B) inflows and deposit repricing pressures.
SBI’s sustainable credit growth guidance of 14%–15% year-on-year will also attract attention. The bank reported credit growth of 18.6% in Q1 FY27.
Asset quality remains another important factor. Gross NPAs had improved to approximately 1.47%–1.50%, while net NPAs were around 0.38%–0.50% in previous reporting periods.
SBI subsidiaries have already reported Q2 FY27 results
SBI Cards +75% Q2 FY27 PAT growth YoY
-
Net profit: ₹778 crore versus ₹445 crore.
-
Revenue: ₹5,302 crore, up 3%.
-
Gross NPA: 1.90%.
-
Credit-loss provisions declined 36.6% to ₹819 crore.
SBI Life Insurance +11% Q2 FY27 PAT growth YoY
-
Net profit: ₹549 crore versus ₹495 crore.
-
Net premium income: ₹2,688 crore, up 8.2%.
-
H1 FY27 profit: ₹1,274 crore, up 17%.
-
Solvency ratio: 1.97.
Management’s FY27 guidance deserves greater attention
Motilal Oswal’s August 10 analysis reported that SBI management maintained:
-
Credit growth guidance of 14%–15%.
-
Domestic NIM guidance of above 3%.
-
Focus on improving loan yields and managing funding costs.
The brokerage also highlighted strong retail, agricultural and SME loan growth during Q1.
Read Here : Nasdaq Slides to Its Worst Day Since June as Chip Stocks Lose 7.2% in One Session
Comparison Table for SBI Q2 FY27 results
The following table is corrected using SBI’s historical Q2 FY26 results and Q1 FY27 results. I have also filled in the missing asset-quality, credit-growth and deposit-growth figures.
SBI financial performance: Q2 FY26 vs Q1 FY27 vs Q2 FY27 expectations
All financial amounts are in ₹ crore unless otherwise specified.
| Financial metric | Q2 FY26 actual | Q1 FY27 actual | Q2 FY27 focus |
|---|---|---|---|
| Standalone PAT | ₹20,160 Cr | ₹21,121 Cr | Profit growth |
| PAT growth YoY | 9.97% | 10.23% | Core earnings momentum |
| Net Interest Income (NII) | ₹42,984 Cr | ₹46,992 Cr | NII growth |
| NII growth YoY | 3.28% | 14.88% | Sustaining growth |
| Domestic NIM | 3.09% | 3.00% | Margin stability |
| Gross NPA | 1.73% | 1.47% | Further improvement |
| Net NPA | 0.42% | 0.38% | Asset-quality stability |
| Credit growth YoY | 12.73% | 18.63% | Loan growth momentum |
| Deposit growth YoY | 9.27% | 9.73% | Deposit mobilisation |
| CASA ratio | 39.63% | 39.24% | Low-cost deposit mobilisation |
Sources: SBI’s official Q2 FY26 results release and Q1 FY27 results disclosures.
1. PAT comparison: Q2 FY26’s ₹20,160 crore profit included a ₹4,593 crore gain from the Yes Bank stake sale. This makes the year-on-year comparison particularly important.
2. NIM pressure: SBI’s domestic NIM declined from 3.09% in Q2 FY26 to 3.00% in Q1 FY27. Investors will watch whether it stabilises or declines further.
3. Asset quality: Gross NPA improved from 1.73% to 1.47%, while net NPA declined from 0.42% to 0.38%.
4. Credit and deposits: Credit growth accelerated to 18.63%, while deposit growth was 9.73% in Q1 FY27. The difference makes deposit mobilisation an important area to monitor.
5. Estimates: Q2 FY27 focus figures are monitoring parameters, not confirmed SBI-specific brokerage forecasts.
Here’s What Happened Today and Why Traders Reacted
SBI’s November 3 results announcement is a scheduled corporate event rather than a report of an earnings surprise. Therefore, the immediate market impact will depend on investor positioning, expectations and developments in the banking sector.
Traders will particularly watch NIM performance, deposit costs, fresh loan slippages and treasury income.
The performance of SBI Cards and SBI Life could also influence expectations around consolidated earnings. SBI Cards reported a 75% increase in Q2 profit, while SBI Life recorded 11% PAT growth, according to the figures provided.
What SBI Q2 Results Could Mean for Shareholders and Investors
SBI shares could experience increased trading activity around the earnings announcement. Stronger-than-expected profit, stable margins and improving asset quality could support positive investor sentiment.
However, weaker NIMs, higher provisions or disappointing management guidance could trigger profit-booking, even if headline net profit remains healthy.
The November 3 announcement will provide a clearer picture of whether SBI can sustain its strong profitability while managing margin pressures. For investors, the biggest signal may not be the net profit number itself, but the quality and sustainability of the bank’s earnings growth.