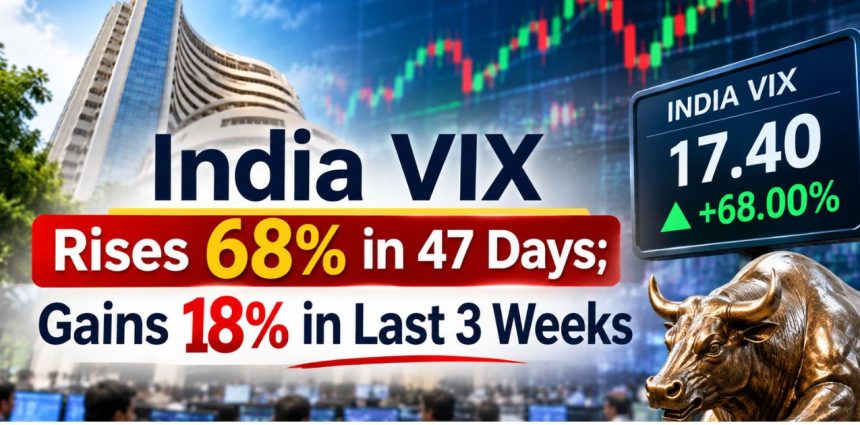
India’s stock market recovery is coming with an important warning from the derivatives market. India VIX, the volatility gauge based on Nifty options prices, stood at approximately 17.4 on November 9, compared with 10.345 on September 23, representing an increase of around 68% in 47 calendar days.
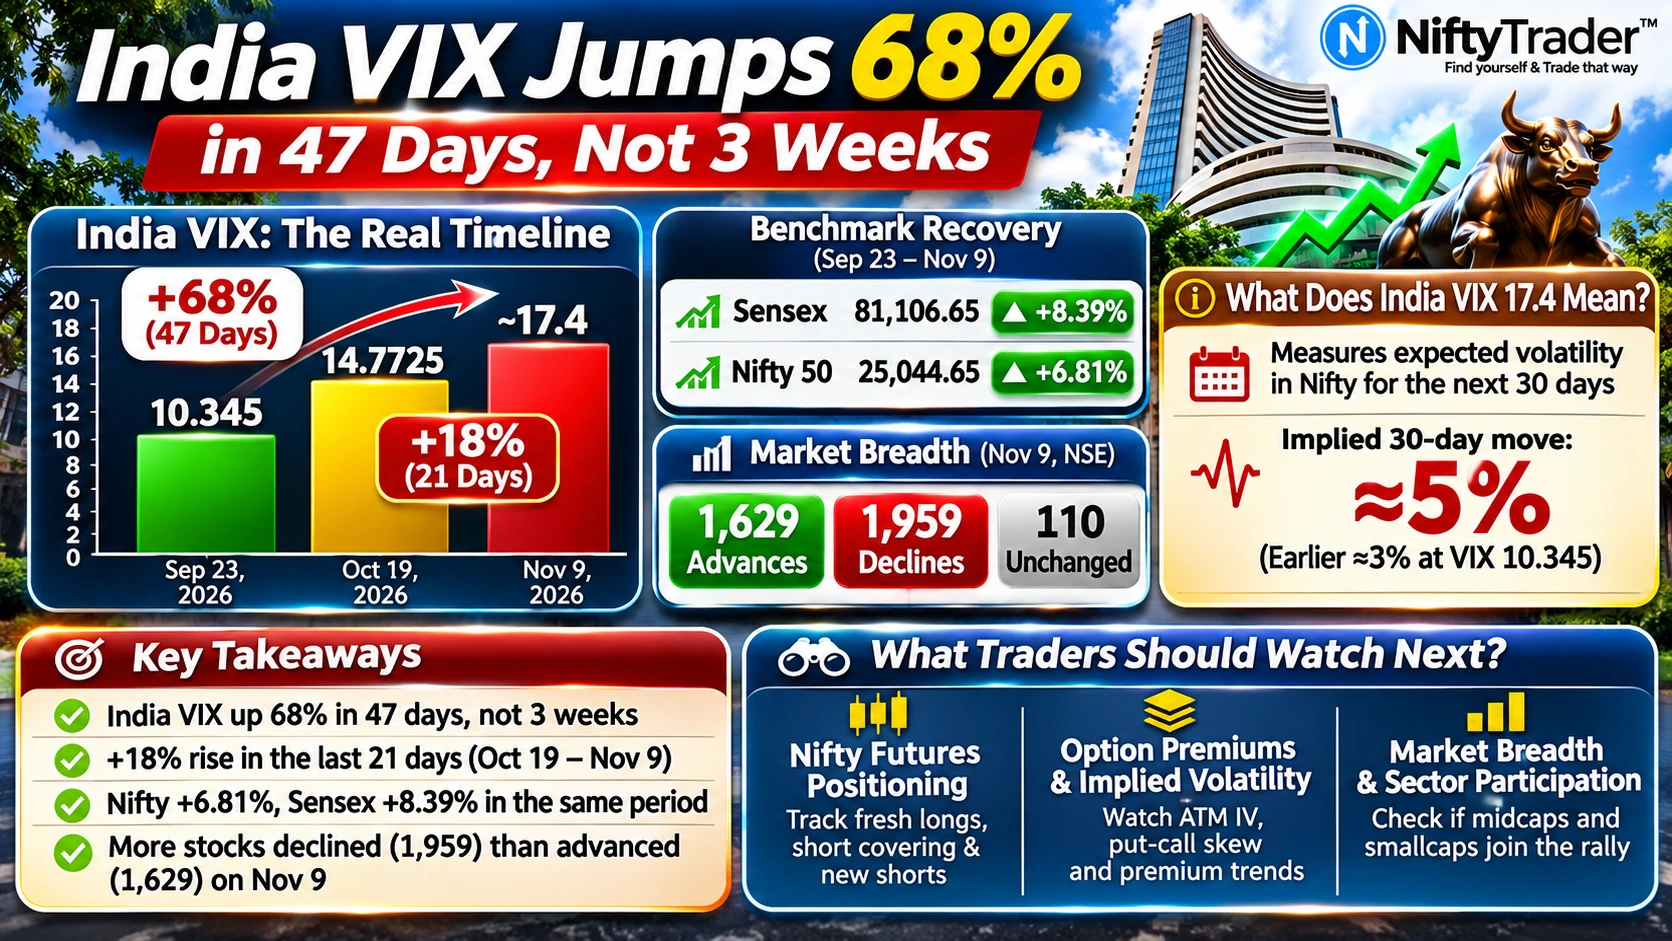
However, the 68% increase did not occur entirely over the last three weeks. India VIX rose from 14.7725 on October 19 to approximately 17.4 on November 9, translating into an additional increase of roughly 18% over 21 calendar days.
The divergence is significant because benchmark indices have also recovered during the longer period. Between September 23 and November 9, the Nifty 50 advanced 6.81% to 25,044.65, while the Sensex gained 8.39% to 81,106.65.
Yet the recovery in headline indices has not translated into uniformly positive market participation. On November 9, 1,959 of the 3,698 stocks traded on the NSE declined, against 1,629 advances and 110 unchanged stocks.
The combination of rising benchmarks, elevated implied volatility and weak one-day market breadth presents a more complicated picture than the headline index gains suggest. It does not necessarily signal an impending correction, but it indicates that market participants are still pricing in significant potential price fluctuations.
Track Live: India VIX Live — Today’s Level, Chart & Range Calculator
India VIX’s 68% Rise Covers 47 Days, Not 3 Weeks
The comparison dates are central to understanding the volatility movement.
India VIX closed at 10.345 on September 23. By November 9, it had reached approximately 17.4, representing an increase of around 68%.
However, the October 19 closing reading was already at 14.7725. From that level, India VIX increased approximately 18% over the following 21 calendar days.
The historical readings show how the increase developed:
| Date | India VIX | Period movement |
|---|---|---|
| September 23, 2026 | 10.345 | Starting level |
| October 19, 2026 | 14.7725 | — |
| November 9, 2026 | Approximately 17.4 | Latest closing level |
| September 23–November 9 | — | Around 68% |
| October 19–November 9 | — | Around 18% |
Source: Historical index closing data; percentage changes calculated by NiftyTrader and rounded.
The comparison shows that a substantial part of the volatility increase had already occurred before the latest three-week period.
For traders, this distinction matters because the 68% figure captures a longer adjustment in expected volatility, while the latest 21-day movement shows that the increase continued into November.
What India VIX at 17.4 Means for Nifty Traders
India VIX measures the market’s expectation of volatility in the Nifty 50 over the next 30 calendar days. It is calculated using the best bid and ask prices of Nifty options and represents annualised expected volatility.
Importantly, it measures the expected magnitude of price fluctuations, not the direction of the next market move.
At an annualised India VIX reading of approximately 17.42, the implied 30-day one-standard-deviation move works out to roughly 5%, using the following conversion:
30-day implied move = VIX × √(30/365)
At the September 23 reading of 10.345, the equivalent estimate was approximately 3%.
This suggests that the options market’s implied scale of potential one-month movement has expanded from around 3% to approximately 5%.
For options traders, the change has practical implications.
Higher implied volatility can increase option premiums, all else being equal. This can make buying options more expensive, while option sellers may face greater exposure to sudden movements in the underlying index.
However, an elevated India VIX does not mean the Nifty is expected to fall by 5%. Nor does it establish a guaranteed upper or lower trading range. Actual market movements can be smaller or larger than the implied estimate.
The important signal is that options prices are reflecting a wider potential range of movement than they were in September.
Track Live: Nifty Levels Today
Why India VIX Can Rise Even When Nifty and Sensex Advance
The relationship between benchmark indices and volatility is not always inverse.
India VIX generally increases when markets decline sharply, as investors seek protection against further losses. However, volatility can also rise during a strong rally.
Rapid upward movements, abrupt intraday reversals and uncertainty about the sustainability of gains can increase the price investors are willing to pay for options. When option premiums rise, implied volatility can increase even if the underlying index is advancing.
This is why a rising market does not automatically translate into falling volatility.
The distinction is particularly relevant when benchmark indices are moving higher but investors remain uncertain about how sustainable the recovery will be.
India VIX is derived from Nifty options prices, so changes in option pricing provide the more direct indication of changing volatility expectations. Futures positioning can offer additional market context, but it should not be treated as proof of what caused the VIX movement.
Market Breadth Adds Another Layer to the Volatility Signal
The November 9 trading session offered another indication of the difference between benchmark performance and broader market participation.
The Nifty 50 gained 0.23% to close at 25,044.65, while the Sensex advanced 0.13% to 81,106.65.
However, the broader NSE market had negative breadth:
- Advancing stocks: 1,629
- Declining stocks: 1,959
- Unchanged stocks: 110
In other words, more stocks declined than advanced even as both headline indices closed higher.
This is a single-session reading, not proof that the entire September-to-November recovery was narrow. Nevertheless, it highlights why traders should look beyond benchmark index levels when assessing market strength.
A sustained recovery supported by wider participation would provide a different market signal from one in which gains remain concentrated in a smaller group of heavyweight stocks.
What Traders Should Monitor as India VIX Remains Elevated
The next movement in India VIX will depend on whether the recent repricing in options markets continues.
Three indicators deserve attention.
1. Nifty futures positioning
Changes in futures open interest alongside price movements can help traders distinguish between fresh long positions, short covering and the creation of new short positions. These patterns can provide context about the sustainability of the market recovery.
2. At-the-money implied volatility and options premiums
Movements in at-the-money implied volatility, put-call skew and option premiums can help establish whether demand for protection remains elevated. A sustained decline in implied volatility would suggest some easing in near-term uncertainty.
3. Market breadth and sector participation
The advance-decline ratio and performance of midcap and smallcap stocks will help determine whether the benchmark recovery is spreading across the wider market.
A broader improvement in participation, alongside easing implied volatility, would indicate a more comfortable market environment. Until then, the divergence between benchmark gains and elevated volatility remains worth monitoring.
Bottom Line
India VIX’s approximately 68% increase since September 23 highlights a substantial repricing of expected market volatility, but the entire increase should not be described as a three-week move.
The more accurate comparison shows an approximately 18% increase over the 21 days between October 19 and November 9. Meanwhile, the Nifty and Sensex advanced 6.81% and 8.39%, respectively, over the longer comparison period.
For traders, the message is not necessarily to expect a market decline. It is that a recovering benchmark index does not automatically mean lower market risk.
Whether India VIX cools further or remains elevated will depend on options pricing, futures positioning and the breadth of the ongoing market recovery. The next phase of the rally may therefore depend as much on improving market participation as on further gains in the headline indices.
Read Next: Nikkei’s 60,000 Comeback Wobbles After 295-Point Pullback