Need to Know
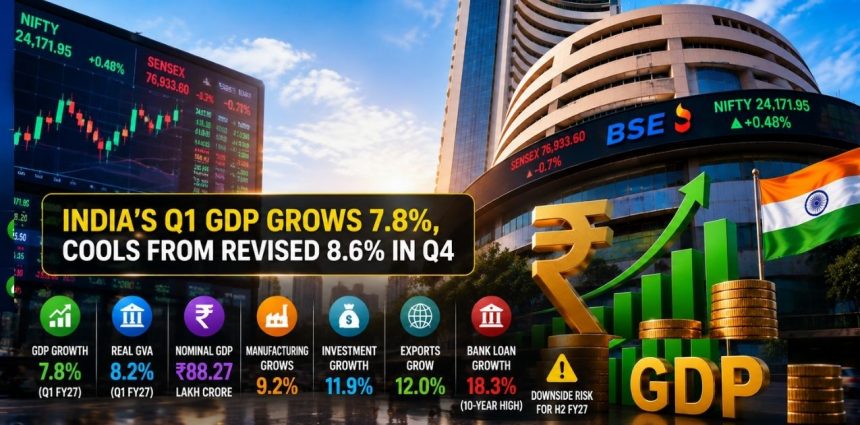
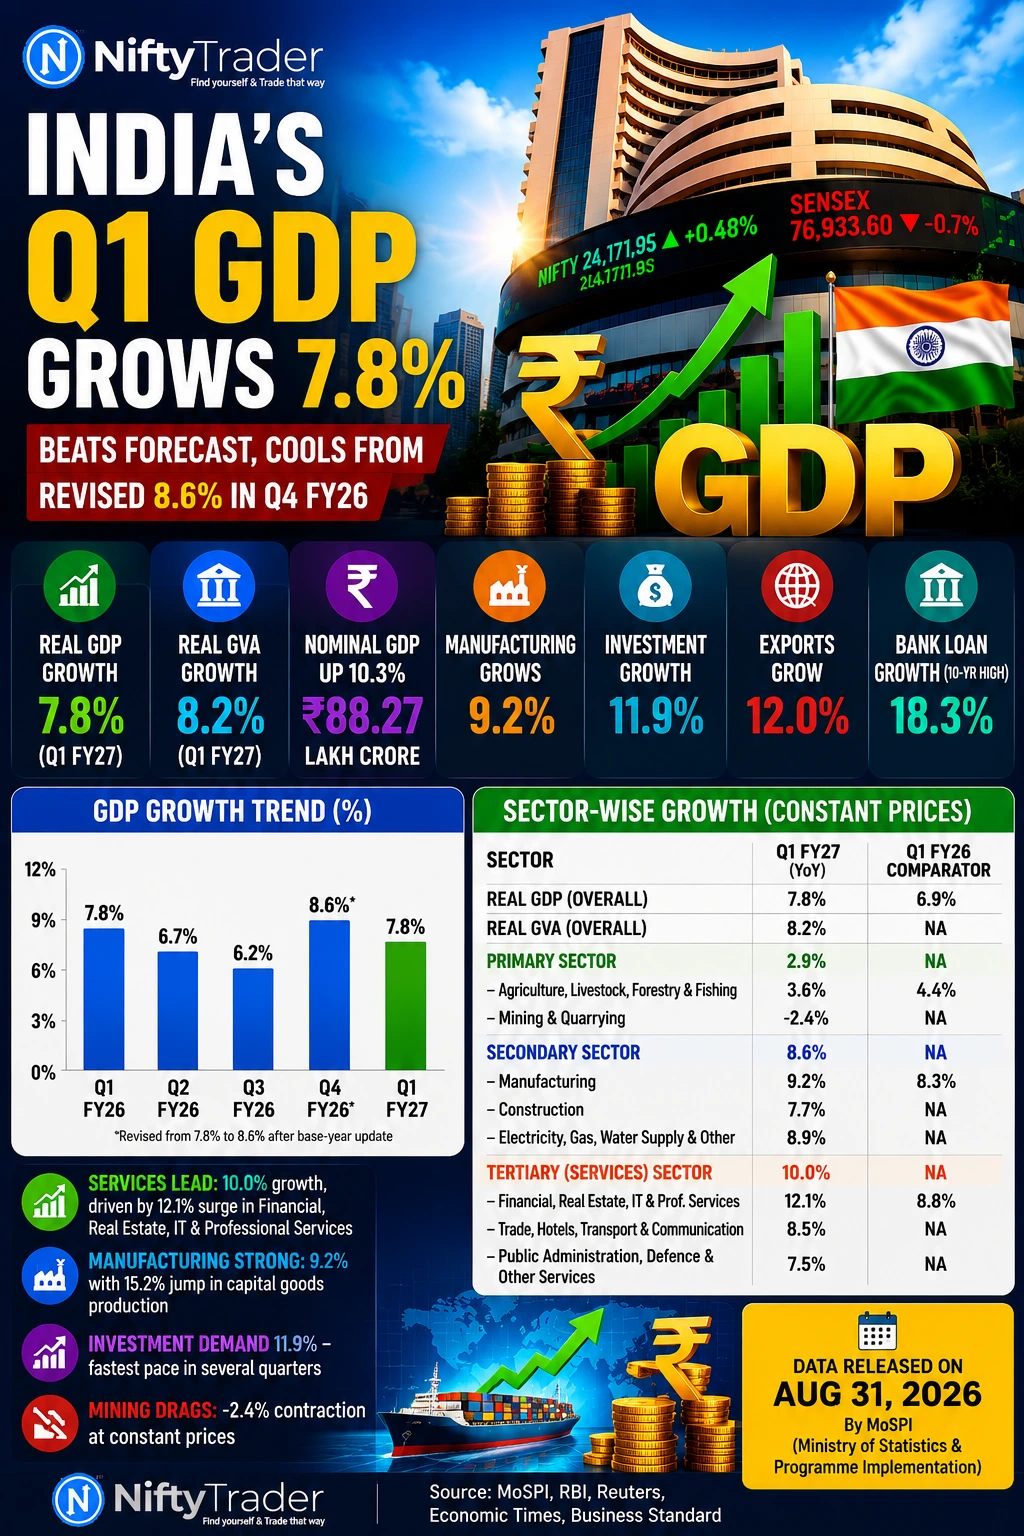
- India’s real GDP grew 7.8% year-on-year in Q1 FY27 (April–June 2026), per data released by the Ministry of Statistics and Programme Implementation (MoSPI) on August 31, 2026, beating the RBI’s 7% projection, a Reuters poll’s 7.1% estimate, and an Economic Times poll’s 7.3% estimate.
- Growth eased sequentially from a revised 8.6% in Q4 FY26 (January–March 2026); MoSPI’s release incorporates updated base-year (2022-23) data that lifted the previously reported Q4 FY26 print from 7.8% to 8.6%, a revision independently confirmed by Reuters’ own coverage of Monday’s release.
- Real GVA grew 8.2% (down from a revised 8.7% in Q4 FY26); real GDP touched ₹81.36 lakh crore against ₹75.46 lakh crore a year earlier, while nominal GDP rose 10.3% to ₹88.27 lakh crore.
- Services led sectoral growth at 10.0%, with Financial, Real Estate, IT & Professional Services surging 12.1% (up from 8.8% a year earlier) on strong bank credit growth; manufacturing grew 9.2% (up from 8.3%); Mining & Quarrying contracted 2.4%.
- Investment demand (Gross Fixed Capital Formation) grew 11.9%, its fastest pace in several quarters, while exports rose 12.0% and bank loan growth hit a decade-high 18.3%, even as the West Asia crisis pushed up input costs.
- Economists flag downside risk for H2 FY27 from elevated commodity prices and the ongoing West Asia conflict; the RBI has since raised its full-year FY27 growth forecast to 6.7% from 6.6%.
Also Read: SBI Q1 GDP Nowcast at 8% vs RBI’s 7%: The Growth Surprise That Could Reprice Indian Stocks
GDP Beats Forecasts, But Eases From an Upwardly Revised Q4
India’s economy grew 7.8% year-on-year in the April–June quarter of FY27, data released by MoSPI showed on August 31, comfortably ahead of the Reserve Bank of India’s 7% projection, a Reuters poll’s 7.1% estimate, and an Economic Times poll of economists that had pegged growth at 7.3%.
Rating agency ICRA, which had projected a sharper slowdown to around 7%, was also caught on the wrong side of the print.
The headline number invites an obvious comparison: growth is unchanged from the 7.8% India logged in Q1 FY26, the same quarter last year.
But the more revealing comparison is sequential, not annual. MoSPI’s Q1 FY27 release folds in updated base-year (2022-23) data, and this has pushed up the previously reported Q4 FY26 (January–March 2026).
The GDP growth figure went from 7.8% to 8.6%, confirmed independently by Reuters, which described Q1 FY27 growth as “slower than the revised 8.6% growth in the previous three months,” and by MoSPI’s own public dashboard, whose pre-revision series still shows the old 7.8% for Q4 FY26.
Read against that revised base, Q1 FY27’s 7.8% print represents a moderation in sequential momentum, not a plateau, a nuance much of the same-quarter-last-year coverage has missed.
Real GVA, which strips out taxes and subsidies, grew 8.2% in Q1 FY27 against a revised 8.7% in the preceding quarter, reinforcing the same sequential-cooling read.
In absolute terms, real GDP at constant prices came in at ₹81.36 lakh crore, up from ₹75.46 lakh crore in Q1 FY26. Nominal GDP rose 10.3% to ₹88.27 lakh crore, while nominal GVA grew 11.5% to ₹80.53 lakh crore.
Sector-Wise Breakdown: Services and Capital Goods Lead, Mining Drags
Growth was broad-based on the supply side but distinctly services-and-investment-led.
The tertiary (services) sector expanded 10.0% at constant prices, the fastest among the three broad sectors, driven by a 12.1% surge in Financial, Real Estate, IT & Professional Services, up from 8.8% in Q1 FY26, and powered by bank credit, which the RBI’s August bulletin shows grew a decade-high 18.3% across farm, industry, and services loans.
Trade, Hotels, Transport & Communication services, the more consumer-facing end, grew a softer 8.5%, while Public Administration, Defence & Other Services rose 7.5%.
The secondary sector grew 8.6%, with manufacturing value addition up 9.2%, an acceleration from 8.3% in Q1 FY26, supported by a 15.2% jump in capital goods production and sharp gains in high-tech manufacturing sub-segments such as electrical equipment (up 27%) and transport equipment (up 19.5%).
Construction held a firm pace at 7.7%, aided by an 8.9% rise in cement output and 8.3% growth in finished steel consumption. Electricity, gas, water supply, and other utility services grew 8.9%.
The primary sector was the laggard, growing just 2.9%. Agriculture, Livestock, Forestry & Fishing rose 3.6%, a slowdown from 4.4% a year earlier despite a delayed monsoon onset, while Mining & Quarrying contracted 2.4% at constant prices, which MoSPI attributed to weaker fuel-mineral output trends.
Reuters frames mining and consumer-facing services as the two soft spots offsetting an otherwise investment-and-manufacturing-led beat.
| Sector (Constant Prices) | Q1 FY27 Growth (YoY) | Q1 FY26 Comparator |
|---|---|---|
| Real GDP (overall) | 7.8% | 6.9% |
| Real GVA (overall) | 8.2% | NA |
| Primary Sector | 2.9% | NA |
| — Agriculture, Livestock, Forestry & Fishing | 3.6% | 4.4% |
| — Mining & Quarrying | -2.4% | NA |
| Secondary Sector | 8.6% | NA |
| — Manufacturing | 9.2% | 8.3% |
| — Electricity, Gas, Water Supply & Utilities | 8.9% | NA |
| — Construction | 7.7% | NA |
| Tertiary Sector (Services) | 10.0% | NA |
| — Financial, Real Estate, IT & Professional Services | 12.1% | 8.8% |
| — Trade, Hotels, Transport, Communication & Broadcasting | 8.5% | NA |
| — Public Administration, Defence & Other Services | 7.5% | NA |
Source: MoSPI Quarterly Estimates of GDP, Q1 (April–June) FY 2026-27, released August 31, 2026, cross-verified with Reuters. Comparator cells marked NA were not independently confirmed against primary data and are omitted rather than estimated.
Investment Demand Surges, Trade Holds Up Despite West Asia Shock
The expenditure-side data points to investment, not just consumption, as the standout driver this quarter.
Gross Fixed Capital Formation (GFCF), the broadest proxy for investment activity, grew 11.9% at constant prices, up sharply from 5.8% in Q1 FY26, and now accounts for 34.3% of nominal GDP.
Private Final Consumption Expenditure (PFCE) rose 7.1% and made up 55.8% of nominal GDP, while Government Final Consumption Expenditure grew a comparatively modest 4.3%.
On trade, exports of goods and services expanded 12.0% at constant prices even as the West Asia crisis kept crude and input costs elevated through the quarter.
Imports contracted 1.1% at constant prices, though nominal import data showed a 51.5% surge in machinery and equipment imports, a signal that domestic capex plans are translating into actual capital-goods buying.
| Expenditure Component | Q1 FY27 Growth (Real, YoY) | Share of Nominal GDP |
|---|---|---|
| Gross Fixed Capital Formation (GFCF) | 11.9% (vs 5.8% in Q1 FY26) | 34.3% |
| Private Final Consumption Expenditure (PFCE) | 7.1% | 55.8% |
| Government Final Consumption Expenditure (GFCE) | 4.3% | NA |
| Exports of Goods & Services | 12.0% | NA |
| Imports of Goods & Services | -1.1% | NA |
Source: MoSPI Quarterly Estimates of GDP, Q1 FY27; NiftyTrader Desk compilation.
Check Live: FII DII DATA | NIFTYTRADER
What Economists Are Saying
HDFC Bank’s principal economist, Sakshi Gupta, pointed to broad-based strength, consumption, government spending, investment and exports all contributed, with financial, real estate, and professional services standing out as the fastest-growing segment.
HDFC Bank has revised its full-year FY27 GDP growth estimate upward to 7%, from 6.8% earlier, citing the strong Q1 print and a broadly stable monsoon that limits downside risk to rural demand.
ANZ Research’s Dhiraj Nim called the beat part of an unusually long run of upside surprises, noting that investment and exports both contributed, reflecting balanced domestic and external demand.
ANZ sees this raising the risk of the FY27 growth forecast tracking above its current 6.7% estimate and expects the print to support the case for continued monetary policy normalisation, though whether strong growth translates into stronger portfolio inflows into equities remains an open question, in ANZ’s view.
Emkay Global’s chief economist Madhavi Arora said the data validates the broader cyclical upturn already visible in high-frequency indicators and corporate earnings and noted that resilient volumes suggest firms have been able to pass through a meaningful share of elevated input costs despite the West Asia crisis.
She flagged, however, that the stronger 8.2% GVA growth appears to partly reflect a sharp rise in net public-sector subsidies outpacing growth in net indirect taxes, a compositional factor worth watching in subsequent quarters.
Outlook: Momentum Likely to Moderate in H2 FY27
The RBI’s Monetary Policy Committee had projected 7% growth for Q1 FY27 and 6.7% for the full year, revised up from 6.6% in its most recent review.
With the actual print running 80 basis points ahead of that quarterly estimate, several economists, including at HDFC Bank and ANZ, have nudged their full-year forecasts higher, though most still expect growth to moderate through the second and third quarters as the West Asia conflict’s effect on energy and raw-material costs feeds through the economy more fully.
Last year’s GST rate cut and personal income tax reductions are seen as having continued to cushion household disposable income in Q1, but economists widely expect the pickup in private investment seen this quarter to be difficult to sustain at the same pace.
Reuters adds a caveat here: even with GFCF at a multi-quarter high, economists believe the six-month-long West Asia conflict is discouraging fresh private capacity-expansion commitments, so this quarter’s investment strength may owe more to government capex and equipment imports than a broad private capex revival.
MoSPI is scheduled to release Q2 FY27 (July–September 2026) GDP estimates on November 30, 2026.
Also Read: RBI’s Inflation Gap Is Growing: What It Means for Rates Next
The Bigger Picture: India’s 2047 Growth Arithmetic
Even at 7.8%, India’s growth trails what would be needed to meet the government’s “Viksit Bharat” (developed nation) ambition by 2047, the centenary of independence.
NITI Aayog Vice-Chairman Ashok Lahiri has estimated that per capita income would need to rise from roughly $2,813 currently to around $18,000 by 2047, implying average annual nominal growth of 9.25% sustained for 21 years.
India’s growth has averaged 6.3% since 2000 and has cleared the 9.25% mark only three times in the past 50 years, in 1975, 1988, and 2021, underlining how demanding that target remains even after a strong quarter like this one.
Read Next: Reliance’s ₹5,000-Crore MSCI Outflow Could Stress India’s New Auction
Disclaimer: This article is for informational purposes only and does not constitute investment advice. Economic data, growth estimates, and analyst commentary cited herein are subject to revision by the issuing authorities. Readers should consult a qualified financial advisor before making investment decisions based on macroeconomic data.